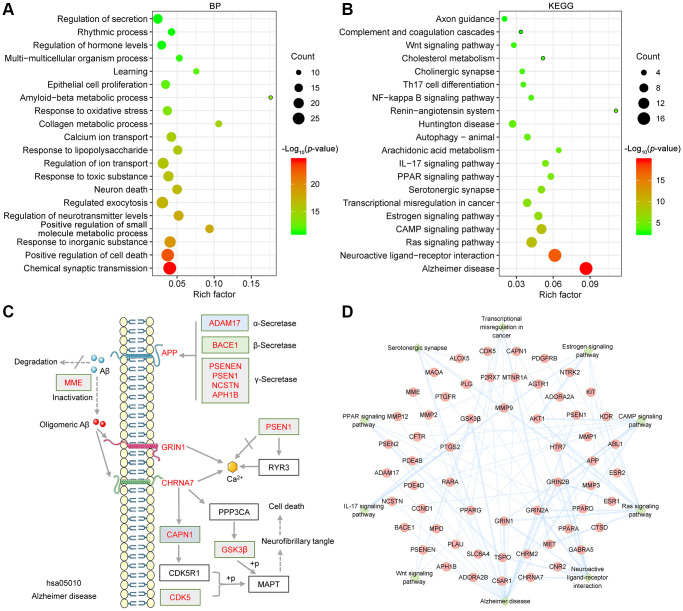
Figure 3.
Bioinformatics analysis of target proteins of GF against AD. (A) Top 20 bubble chart of biological process of GO enrichment analysis. (B) The top 20 KEGG pathways are presented in the bubble chart. (C) The genes involved in the Alzheimer disease pathway are presented in the mechanistic diagram of AD pathology. (D) Top 10 significantly enriched KEGG pathways are shown as a network diagram. Red circle nodes represent target proteins, and green diamond nodes represent enriched KEGG pathways. X-axis, rich factor; bubble size, the number of targets enriched; bubble color, p value.

