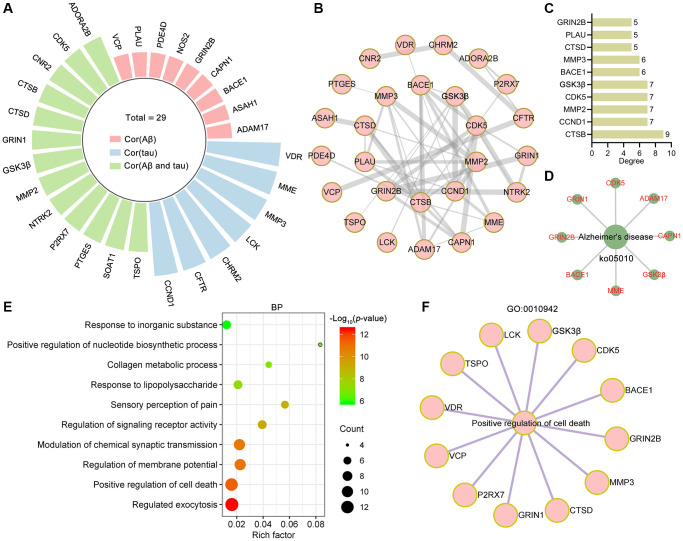
Figure 4.
Bioinformatics analysis of targets related to Aβ and tau pathology. (A) Radial bar plot showing the target proteins significantly correlated with tau, Aβ or Aβ and tau. (B) PPI network construction for proteins correlated with tau, Aβ or Aβ and tau. (C) The top 10 core targets from the PPI network were ranked by degree. (D) Network diagram showing target proteins involved in Alzheimer's disease (ko05010). (E) Top 10 bubble chart of biological process of GO enrichment analysis. X-axis, rich factor; bubble size, the number of targets enriched; bubble color, p value. (F) Network diagram showing target proteins involved in positive regulation of cell death (GO: 0010942).

