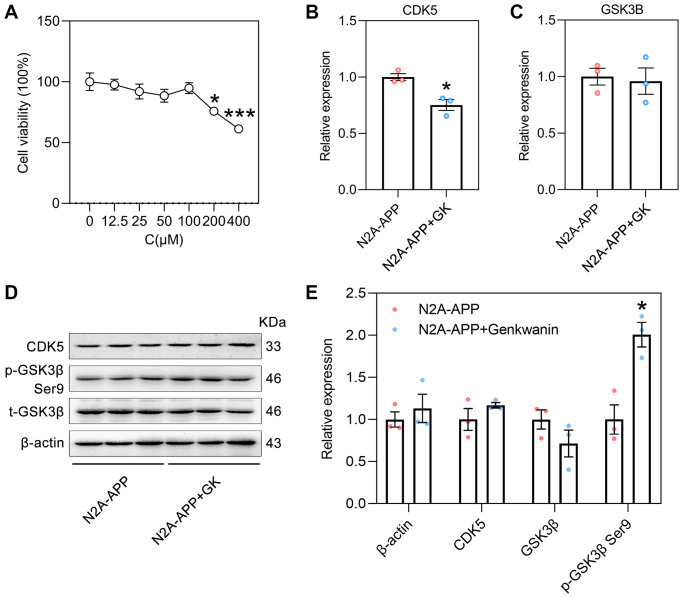
Figure 8.
The effect of GK on CDK5 and GSK3β in N2A-APP cells. (A) The viability of genkwanin treated N2A-APP cells were measured at different concentration using CCK-8 analysis for 48 h (n = 5). Data were expressed as the means ± SEM. *p < 0.05, ***p < 0.001 vs 0 μM. (B, C) The level of CDK5 and GSK3β were normalized to the level of β-actin mRNA (n = 3/group). (D, E) Protein level of CDK5, phosphorylated GSK3β (p-GSK3β, Ser9) and total GSK3β (t-GSK3β) were measured by Western blotting and quantitatively analyzed (n = 3/group). β-actin was used as a protein loading control. N2A-APP cells treated with 0.1% DMSO solvent served as controls. Data were expressed as the means ± SEM. *p < 0.05, **p < 0.01 vs N2A-APP group.

