Figure 5.

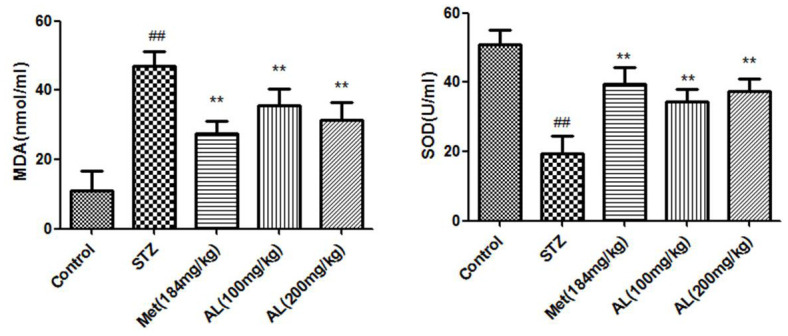
SOD activity and MDA content in serum. Values are expressed as means±SDs. Compared with control: # P<0.05, ##P<0.01; Compared with model:*P<0.05, **P<0.01.

SOD activity and MDA content in serum. Values are expressed as means±SDs. Compared with control: # P<0.05, ##P<0.01; Compared with model:*P<0.05, **P<0.01.