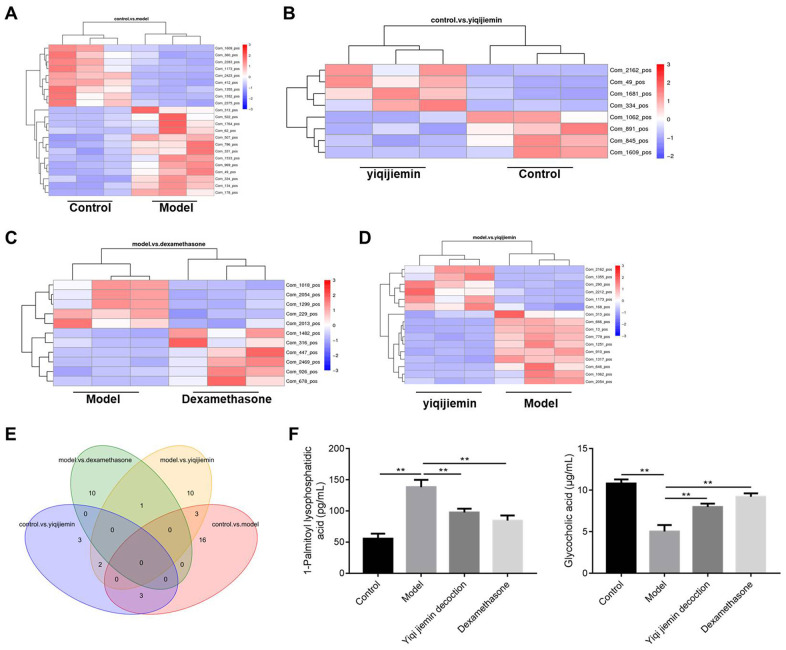
Figure 4.
YJD treatment reverses serum metabolite changes in the AR model guinea pigs. (A–D) Heat map shows clustering of various metabolites as analyzed by LC-HRMS in the control vs. AR model, AR model plus YJD vs. control, AR model vs. AR model plus dexamethasone, and AR model vs. AR model plus YJD groups. (E) Venn diagram shows the common metabolites that are differentially expressed when comparing control vs. AR model, AR model plus YJD vs. control, AR model vs. AR model plus dexamethasone, and AR model vs. AR model plus YJD groups. (F) ELISA assay results show the levels of LPA and GCA metabolites in the serum of control, AR model, AR model plus YJD, and AR model plus dexamethasone groups.

