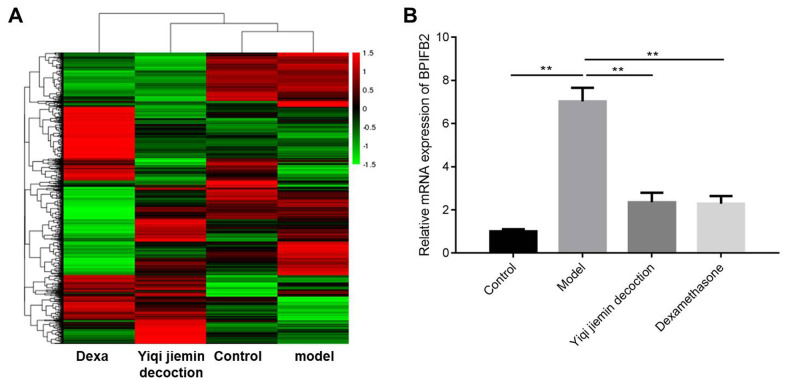
Figure 6.
Identification of differentially expressed genes (DEGs) in the nasal mucosal tissues of AR model guinea pigs treated with YJD or dexamethasone. (A) Heat map shows differentially expressed genes (DEGs) in the nasal mucosal samples from the control, AR model, AR model plus YJD, and AR model plus dexamethasone groups. The color code (green to red) denotes the relative expression levels of the DEGs (high or low). (B) QRT-PCR analysis shows BPIFB2 mRNA levels in the nasal mucosal samples from the control, AR model, AR model plus YJD, and AR model plus dexamethasone groups. *P < 0.05; **P < 0.01; one-way ANOVA.

