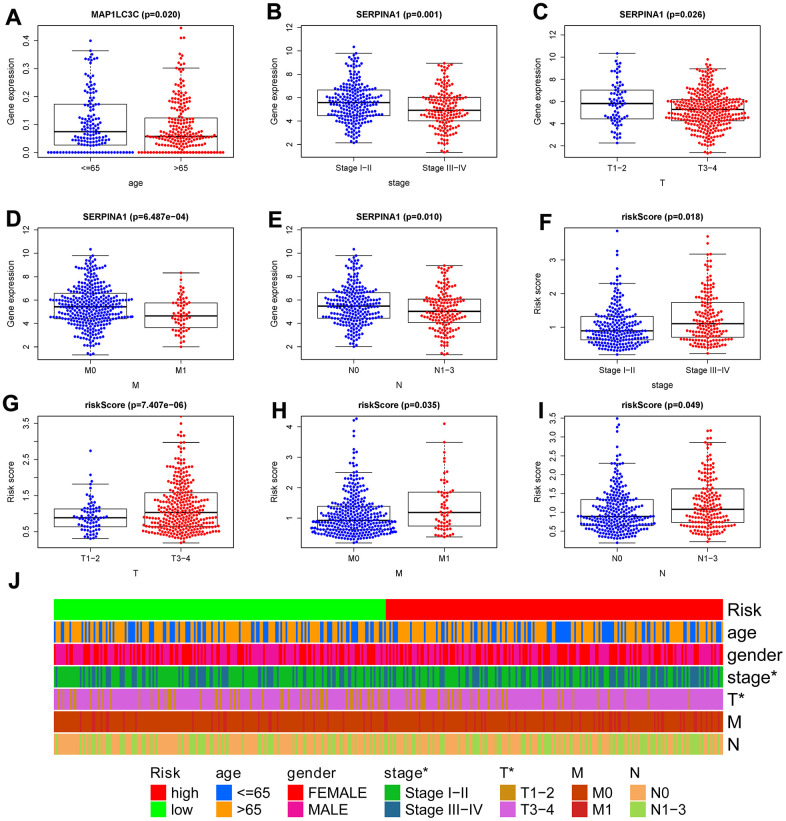
Figure 8.
Correlation between risk score signature and clinicopathological characteristics. (A) RNA expression levels of MAP1LC3C in subgroups with different age; RNA expression levels of SERPINA1 in subgroups with distinct stage (B), T (C), M (D), N (E); risk-score in subgroups with different stage (F), T (G), M (H), N (I). (J) A strip chart showed the correlation between risk score signature and clinicopathological characteristics; *p < 0.05; **p < 0.01; ***p < 0.001.

