FIGURE 1:
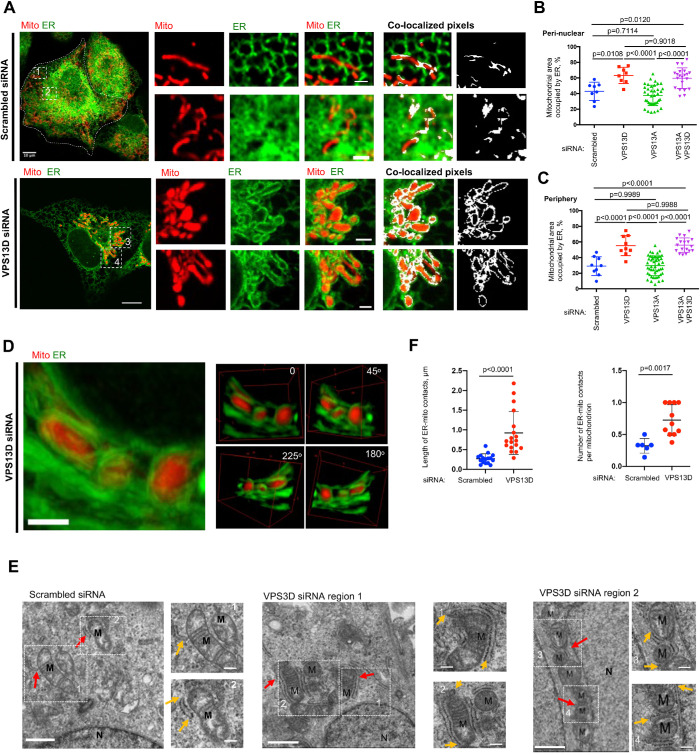
VPS13D suppression led to extensive ER–mitochondria tethering. (A) Confocal images of live U2OS cells labeled with mCherry-mito7 (red) and ER-mGFP (green) upon treatment with either scrambled siRNAs (top) or VPS13D-specific siRNAs (bottom). Left: whole cell image; Middle: ER–mitochondria intersections at cell periphery (top inset) or at perinuclear region (bottom inset); Eight: colocalization-based analysis of ER and mitochondria intersections, with white pixels showing potential contacts. (B, C) Quantification of extent of physical interactions between ER and mitochondria in perinuclear (B) and peripheral regions (C) based on colocalization-based analysis showing the percentage of mitochondrial surface covered by ER. For perinuclear region, scrambled (n = 8), VPS13D (n = 8), VPS13A (n = 38), or VPS13A&D siRNAs (n = 21) were analyzed. For peripheral region, scrambled (n = 9), VPS13D (n = 9), VPS13A (n = 49), or VPS13A&D siRNAs (n = 18) were analyzed. One-way ANOVA was followed by Tukey’s multiple comparisons test. Mean ± SD. (D) Left: Maximum-intensity projection of 10 z stacks (0.2 μm thickness in each stack) of confocal micrographs of ER–mitochondria MCSs at a perinuclear region. Right: 3D reconstruction of ER–mitochondria MCSs from four angles of view along the z-axis. (E) TEM micrographs showing examples of ER–mitochondria contacts in scrambled or VPS13D siRNAs–treated cells with two insets on right. Examples of ER–mitochondria contacts are indicated by red arrows, and yellow arrows in insets indicate the extension of ER–mitochondria MCSs. M indicates mitochondria. MCSs under TEM were defined as regions within 30–nm gaps between ER and OMM (Csordas et al., 2006). (F) Quantification of length of ER–mitochondria MCSs (left panel) and number of ER–mitochondria MCSs per mitochondrion (right panel). In these quantifications, scrambled cells (n = 16 MCSs) and VPS13D siRNA–treated cells (n = 18 MCSs) are analyzed. Two-tailed unpaired Student’s t test. Mean ± SD. Scale bar, 10 μm in whole-cell image and 2 μm in insets in A; 2 μm in D; 1 μm in big region and 0.2 μm in insets in E.

