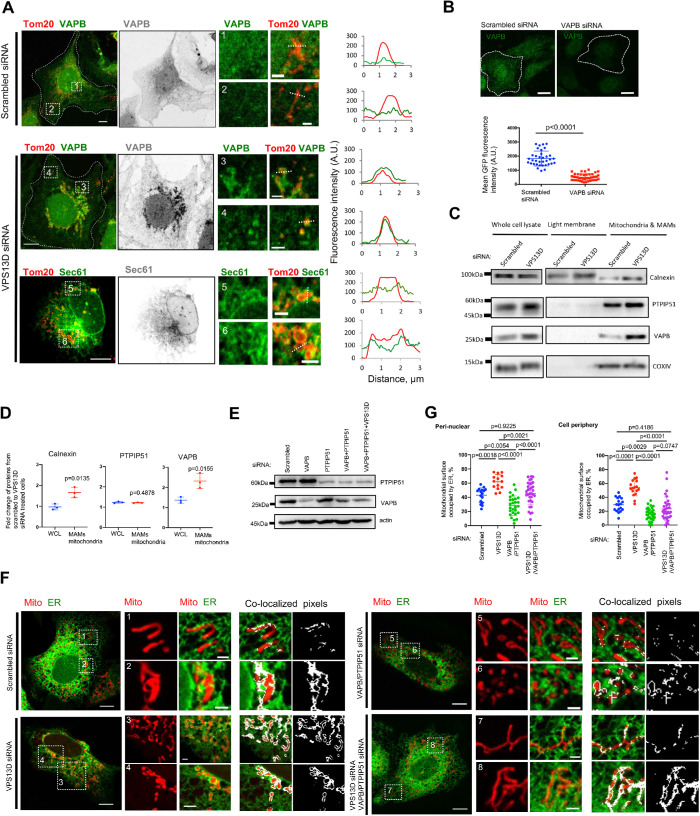
FIGURE 2:
VPS13D negatively regulates the level of VAPB at ER contacts. (A) Immunostaining of U2OS cells treated with either scrambled (top) or VPS13D siRNAs (bottom) with anti-VAPB antibody (green, Top and Middle) or Sec61 (green, Bottom) and anti-Tom20 antibody (red). Left panel: merged image of whole cells; Middle panel: VAPB (gray, Top and Middle) or Sec61 (gray, Bottom); right panel showing two insets with one onset from cell perinuclear regions (top) and the other from cell periphery (bottom) with linescan analysis on the right. (B) Top: immunostaining of fixed U2OS cells treated with scrambled (left) or VAPB-specific siRNAs (right) with anti-VAPB antibody (green). Contrast range of images was set to 600–10,000 for both scrambled and VAPB siRNAs–treated cells. Bottom: the mean fluorescence of VAPB signals was quantified in scrambled (n = 35) and VAPB siRNA (n = 46)–treated cells. Mean intensity is defined as total fluorescence divided by the area of cells. Two-tailed unpaired Student’s t test. Mean ± SD. (C) Cell fractionations were analyzed by immunoblots for calnexin (ER and MAMs), PTPIP51 (a tether on the OMM), VAPB (a tether on the ER membrane), and COXIV (mitochondria). The WCLs were analyzed as a control. (D) Ratio of the levels of proteins (calnexin, PTPIP51, and VAPB) in scrambled cells to those in VPS13D-suppressed cells. Three independent assays were analyzed. Two-tailed unpaired Student’s t test. Mean ± SD. (E) Immunoblots with antibodies against PTPIP51 and VAPB to demonstrate knockdown efficiency. (F) Confocal images of live U2OS cells expressing mCherry-mito7 and ER-mGFP upon treatment with scrambled, VPS13D siRNAs, VAPB+PTPIP51 siRNAs, or VPS13D+VAPB+PTPIP51 siRNAs. White pixels represented ER–mitochondria contacts. (G) Quantification of the extent of physical interactions between the ER and mitochondria at perinuclear (left panel) and peripheral regions (right panel) based on colocalization-based analysis showing the percentage of mitochondrial surface covered by ER. U2OS cells treated with scrambled (perinuclear: 16 ROIs; peripheral: 18 ROIs), VPS13D (perinuclear: 14 ROIs; peripheral: 17 ROIs), VAPB+PTPIP51 (perinuclear: 27 ROIs; peripheral: 33 ROIs), or VPS13D+VAPB+PTPIP51 (perinuclear: 33 ROIs; peripheral: 33 ROIs) siRNAs were analyzed. One-way ANOVA followed by Tukey’s multiple comparisons test. Mean ± SD. Scale bar, 10 μm in whole cell image and 2 μm in insets in A, B, and F.

