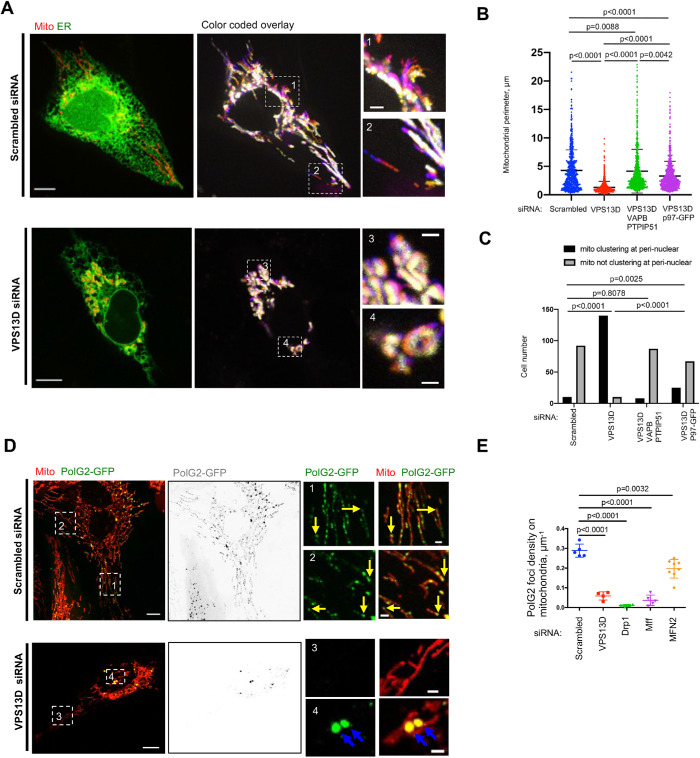
FIGURE 4:
VPS13D suppression results in defects of mitochondrial motility, morphology, cellular distribution, and mtDNA synthesis. (A) Left: whole cell image of U2OS expressing ER (green) and mitochondrial (red) markers were treated either with scrambled or VPS13D siRNA. Right: overlays of mitochondrial dynamics time course with two insets. Colors depict time points in the sequence, with white indicating relative immobility (Supplementary Video 1). (B) Mitochondrial perimeter in scrambled siRNA (669 mitochondria from 52 cells), VPS13D siRNAs–treated U2OS cells (754 mitochondria from 53 cells), VPS13D/VAPB/PTPIP51 siRNAs–treated U2OS cells (742 mitochondria from 51 cells), and VPS13D siRNAs/p97-GFP–treated U2OS cells (746 mitochondria from 49 cells). One-way ANOVA followed by Tukey’s multiple comparisons test. Mean ± SD. (C) Mitochondrial localization in scrambled siRNA (102 cells), VPS13D siRNAs–treated U2OS cells (150 cells), VPS13D/VAPB/PTPIP51 siRNAs–treated U2OS cells (95 cells), and VPS13D siRNAs/p97-GFP–treated U2OS cells (92 cells). Chi-squared and Fisher’s exact tests. (D) Confocal images of live polG2-GFP stable U2OS cells expressing mCherry-mito7 (red) up treatments with scrambled (Top) or VPS13D siRNAs (Bottom). Yellow arrows indicate replicating mtDNA at mitochondrial tips in scrambled cells; blue arrows indicate aggregation of replicating mtDNA in VPS13D siRNA–treated cells. (E) Quantification of the density of replicating mtDNA. The definition of density of replicating mtDNA is number of replicating mtDNA divided by the perimeter of mitochondria in the whole cell. Scrambled (n = 16), VPS13D siRNA (n = 11), Drp1 siRNA (n = 6), Mff siRNA (n = 10), and MFN2 siRNA–treated cells (n = 8) are analyzed. Two-tailed unpaired Student’s t test. mean ± SD. Scale bar, 10 μm in whole-cell image and 2 μm in insets in A and D.

