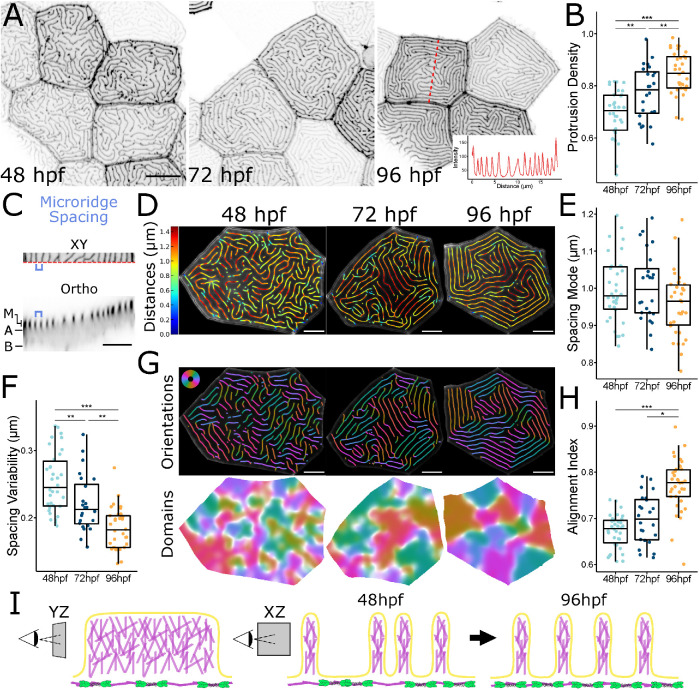
FIGURE 1:
Microridge patterns mature over time. (A) Representative images of periderm cells expressing Lifeact-GFP in zebrafish larvae at the specified developmental stage. Images were inverted so that high intensity fluorescence appears black and low intensity is white. Inset at 96 hpf is an intensity line profile plot along the dashed red line in the associated image, showing the regular spacing between adjacent microridges along the line. (B) Dot and box-and-whisker plot of microridge density, defined as the sum microridge length (μm) normalized to apical cell area (μm2), on periderm cells at the specified stage; 48 hpf, n = 34 cells from 12 fish; 72 hpf, n = 24 cells from 10 fish; 96 hpf, n = 34 cells from 15 fish. P = 1.87 × 10⁻⁹, one-way ANOVA followed by Tukey’s HSD test: 48–72 hpf, P = 3.32 × 10⁻³; 48–96 hpf, P = 1.17 × 10⁻⁹; 72–96 hpf, P = 6.65 × 10⁻³. (C) Microridge-to-microridge spacing. Top: cropped image of a 96 hpf periderm cell expressing Lifeact-GFP. The blue bracket shows the distance between two adjacent microridges. Bottom: orthogonal optical section from the above periderm cell along the dashed red line at the bottom edge of the XY image. M, microridge protrusions; A, apical; B, basal. Blue bracket shows the distance between the same microridges as above. (D) Visualization of microridge spacing at three developmental stages. Color coding indicates the distance from each point on each microridge to the nearest neighboring microridge. Colors correspond to the distances indicated on the bar to the left. (E) Dot and box-and-whisker plots of the mode distance between neighboring microridges in periderm cells at the specified stage; 48 hpf, n = 34 cells from 12 fish; 72 hpf, n = 24 cells from 10 fish; 96 hpf, n = 34 cells from 15 fish. P = 0.089, one-way ANOVA. (F) Dot and box-and-whisker plot of microridge spacing variability, defined as the interquartile range of distances between neighboring microridges in periderm cells at the specified stages; 48 hpf, n = 34 cells from 12 fish; 72 hpf, n = 24 cells from, 10 fish; 96 hpf n = 34 cells from 15 fish. P = 9.91 × 10⁻¹⁰, one-way ANOVA followed by Tukey’s HSD test: 48–72 hpf, P = 7.72 × 10⁻³; 48–96 hpf, P = 8.11 × 10⁻¹⁰; 72–96 hpf, P = 1.90 × 10⁻³. (G) Visualization of microridge orientations at the specified stages. Microridge orientations are color-coded along each microridge (top); colors correspond to the color wheel on the top left. Microridge alignment domains were expanded from microridge orientations (bottom), using the same color wheel and scale as above. See Materials and Methods for details. (H) Dot and box-and-whisker plot of the microridge alignment index for periderm cells at the specified stages; 48 hpf, n = 34 cells from 12 fish; 72 hpf, n = 24 cells from 10 fish; 96 hpf, n = 34 cells from 15 fish. P = 2.96 × 10⁻¹², one-way ANOVA followed by Tukey’s HSD test: 48–72 hpf, P = 0.121; 48–96 hpf, P = 4.02 × 10⁻¹⁰; 72–96 hpf, P = 8.79 × 10⁻⁷. (I) Diagram of microridge structure and spacing. (YZ) Branched actin fills microridge protrusions, depicted as a lengthwise section, the apical actomyosin cortex is shown below the protrusions. (XZ) Microridge spacing, depicted as a cross-section, is variable after microridge formation (48 hpf), but gradually matures to a more regularly spaced pattern (96 hpf). Scale bars: 10 μm (A) and 5 μm (C, D, and G). *p ≤ 0.05, **p ≤ 0.01, and ***p ≤ 0.001. For box-and-whisker plots, the middle line is the median, and the bottom and top ends of boxes are 25th and 75th percentiles, respectively.

