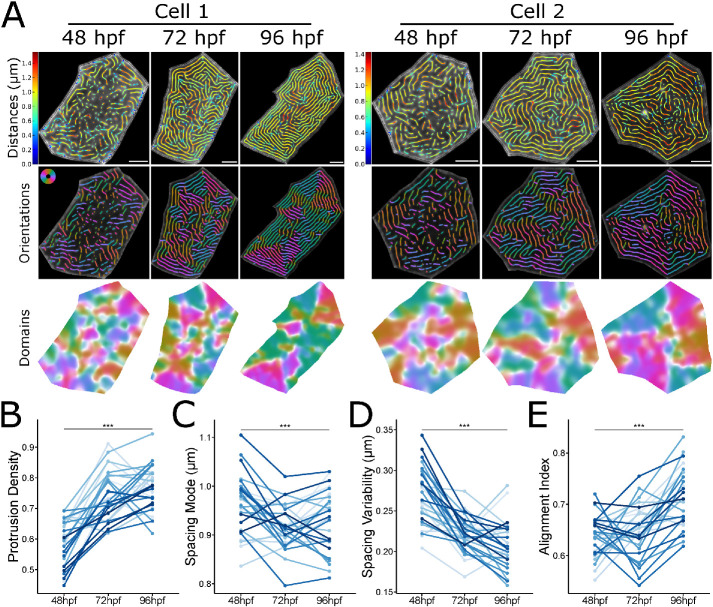
FIGURE 2:
Microridge patterns mature on individual periderm cells. (A) Microridge distances, orientations, and alignment domains in two cells from 48–96 hpf. (B) Line and point plot of microridge density, defined as the sum microridge length (μm) normalized to apical cell area (μm2), in periderm cells over time; n = 28 cells from 9 fish. P = 5.87 × 10⁻¹⁵, one-way repeated measures ANOVA. (C) Line and point plot of the mode distances between neighboring microridges in periderm cells over time. n = 28 cells from 9 fish. P = 4.08 × 10⁻⁴, one-way repeated measures ANOVA. (D) Line and point plot of microridge spacing variability (interquartile range of distances) between neighboring microridges in periderm cells over time; n = 28 cells from 9 fish. P = 7.37 × 10⁻¹¹, one-way repeated measures ANOVA. (E) Line and point plot of microridge alignment index in periderm cells over time; n = 28 cells from 9 fish. P = 5.16 × 10⁻⁸, one-way repeated measures ANOVA. Scale bars: 5 μm (A). ***p ≤ 0.001.

