FIGURE 3:
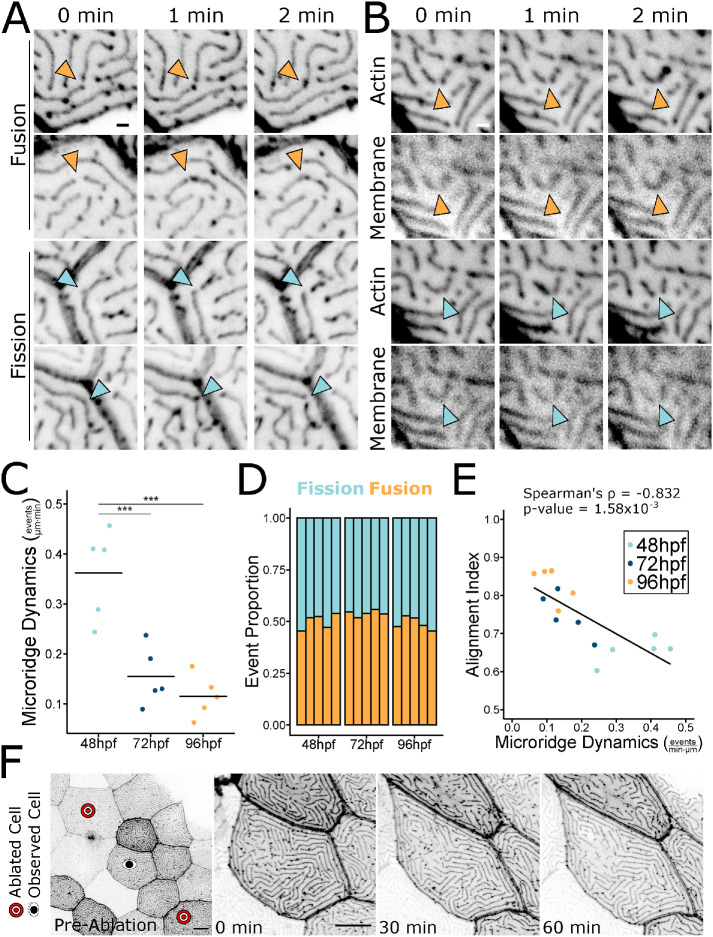
Microridges dynamically rearrange. A) Stills from time-lapse movies of 48 hpf periderm cells expressing Lifeact-GFP, showing microridges undergoing fission or fusion. Orange arrowheads indicate fusion; blue arrowheads indicate fission. Images were inverted, so that high intensity fluorescence appears black and low intensity is white. Images are still frames from Supplemental Video S2. (B) Stills from time-lapse movies of 48 hpf periderm cells expressing Lifeact-GFP (actin) and mRuby-PH-PLC (membrane), showing microridges undergoing fission or fusion. Orange arrowheads indicate fusion; blue arrowheads indicate fission. Images were inverted, so that high intensity fluorescence appears black and low intensity is white. Images are still frames from Supplemental Video S3. (C) Jittered dot plot of the sum of fission and fusion events in each cell, normalized to cell apical area, over a 9.5-min period (events/μm⋅min) at the specified stage. Middle bar represents the mean. n = 5 cells from 5 fish at all stages. P = 1.62 × 10⁻⁴, one-way ANOVA followed by Tukey’s HSD test: 48–72 hpf, P = 9.75 × 10⁻⁴; 48–96 hpf, P = 2.17 × 10⁻⁴; 72–96 hpf, P = 0.629. (D) Stacked bar plot of the proportion of fission and fusion events indicated stages. Each bar represents one cell, n = 5 cells from 5 fish at all developmental stages. Fusion events were used in a Test of Equal Proportions (P = 0.224) and fusion event proportion estimates were 0.501, 0.543, and 0.488 for 48, 72, and 96 hpf, respectively. (E) Scatter plot of microridge dynamics (events/μm⋅min) over a 9.5-min period vs. the microridge alignment index at the start of the 9.5-min period; n = 5 cells from 5 fish at all developmental stages. P = 1.16 × 10⁻⁴, Spearman’s rank correlation ρ = –0.832. (F) Stills from a time-lapse movie of Lifeact-GFP-expressing periderm cells stretching in response to neighbor cell ablation in a 72 hpf zebrafish. Preablation image shows the cell of interest between the ablated cells and the images of the cell of interest immediately after ablation (0 min) and at 30-min intervals after ablation. The cell stretched dramatically, but microridge rearrangements did not appreciably increase. Microridge rearrangements occurred at a rate of 0.00393 events/μm⋅min over the course of the video (compare to rates in C). Images were inverted, so that high intensity fluorescence appears black and low intensity is white. Images are still frames from Supplemental Video S4. Scale bars: 1 μm (A and B) and 10 μm (E). ***p ≤ 0.001.

