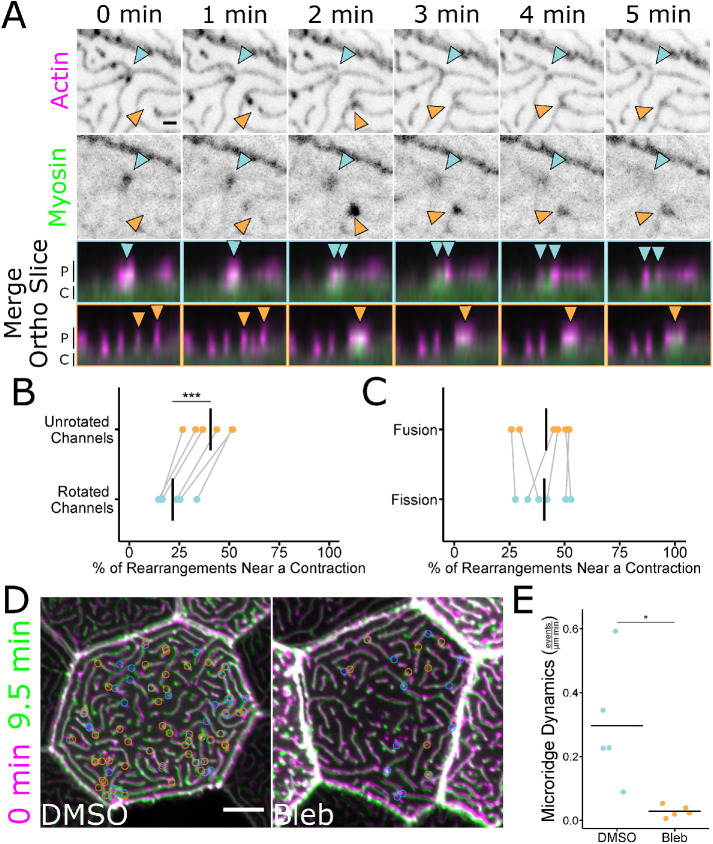
FIGURE 4:
Microridge rearrangements spatially and temporally correlate with NMII contraction. (A) Stills from a time-lapse movie of 48 hpf zebrafish periderm cells expressing Lifeact-mRuby (actin) and Myl12.1-EGFP (myosin). Microridge fission occurred as a myosin contraction event dissipated (blue arrowheads). Microridges fused as a myosin contraction intensified (orange arrowheads). Merged images show the microridge protrusions (P) and apical cortex (C) of the above fission (blue arrowheads and borders) and fusion (orange arrowheads and borders) events from an orthogonal view. Single-channel images were inverted, so that high intensity fluorescence appears black and low intensity is white. Images are still frames from Supplemental Video S5. (B) Dot plot of the percentage of microridge fission and fusion events within 1 μm of an NMII contraction over a 9.5-min period. The graph compares unrotated channels to data analyzed after rotating the NMII fluorescence channel 90° relative to the actin fluorescence channel. The gray lines connect the unrotated samples to their rotated counterparts; n = 6 cells from 6 fish, including 3 cells from 3 fish at 24 hpf and 3 cells from 3 fish at 48 hpf. P = 2.27 × 10⁻⁴, paired t test. (C) Dot plot of the percentage of microridge fission and fusion events within 1 μm of an NMII contraction event over a 9.5-min period. The graph compares contraction-associated fusion events to contraction-associated fission events in the same cells. The gray lines connect points from the same cell; n = 6 cells from 6 fish, including 3 cells from 3 fish at 24 hpf and 3 cells from 3 fish at 48 hpf. P = 0.778, paired t test. (D) Overlap frames from 9.5-min time-lapse movies of 49 hpf zebrafish periderm cells expressing Lifeact-GFP after 1-h exposure to 1% DMSO (vehicle control) or 50 μM blebbistatin. Circles indicate the locations where fission (blue) and fusion (orange) events were detected over the course of the 9.5-min movies (frames were collected at 30-s intervals). Overlapped images are from Supplemental Video S6. (E) Jittered dot plot of the sum of fission and fusion events in each cell, normalized to cell apical area, over a 9.5-min period (events/μm⋅min) in cells after 1-h exposure to 1% DMSO (vehicle control) or 50 μM blebbistatin; n = 5 cells from 5 fish for control and treatment. P = 0.033, unpaired t test. Scale bars: 1 μm (A) and 5 μm (D). *p ≤ 0.05 and ***p ≤ 0.001. Bars in dot plots represent the mean.

