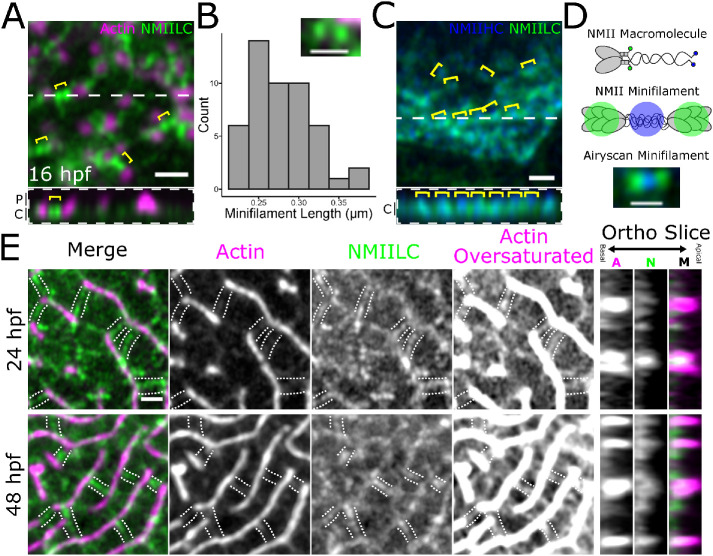
FIGURE 7:
NMII minifilaments connect adjacent pegs and microridges. (A) Airyscan image of a 16 hpf zebrafish periderm cell expressing fluorescent reporters for actin (Lifeact-Ruby) and NMII light chain (Myl12.1-GFP). Pairs of green puncta (yellow brackets) appear in the cortex between adjacent pegs (magenta puncta). Below is an orthogonal view of the peg protrusions (P) and apical cortex (C) along the dashed white line in the top image. (B) Histogram of distances between the intensity maxima of presumptive NMII minifilaments. Inset is a representative image showing GFP signal at opposing ends of a presumptive NMII minifilament in a periderm cell expressing reporters for actin (Lifeact-Ruby) and NMII light chain (Myl12.1-GFP); n = 49 minifilaments from 4 cells on 4 fish. (C) Airyscan image of a 24 hpf zebrafish periderm cell expressing fluorescent reporters for NMII heavy chain (NMIIHC, Myh9a-mCherry) and NMII light chain (NMIILC, Myl12.1-GFP). NMIIHC channel was pseudo-colored blue. Yellow brackets show examples of GFP-mCherry-GFP fluorescence patterns. Below is an orthogonal view of apical cortex (C) along the dashed white line in the top image. (D) Diagram of NMII fluorescent protein fusion design and expected NMII minifilament fluorescence pattern. The top graphic shows an NMII macromolecule, composed of two heavy chains, two essential light chains, and two regulatory light chains. GFP was fused to the regulatory light chains (Myl12.1-GFP), while mCherry was fused to the tail of the heavy chains (Myh9a-mCherry; represented in blue). The middle graphic shows the expected fluorescence pattern when multiple NMII macromolecules, labeled like the one in the top graphic, assemble into an NMII minifilament. The bottom Airyscan image shows an NMII minifilament in the cortex of a 24 hpf zebrafish periderm cell expressing Myl12.1-GFP and Myh9a-mCherry. (E) Airyscan images showing NMII minifilaments connecting adjacent microridges side-to-side and end-to-end during (24 hpf) and after (48 hpf) microridge formation in periderm cells expressing reporters for actin (Lifeact-Ruby) and NMII light chain (Myl12.1-GFP). The oversaturated images reveal actin filaments in the cortex. The panels to the right show actin (C), NMII (N),s and merged channels (M) in an orthogonal section. The dotted lines track along NMII minifilament “bridges” and F-actin in the apical cortex. Scale bars: 1 μm (A, C, and E) and 500 nm (B and D)

