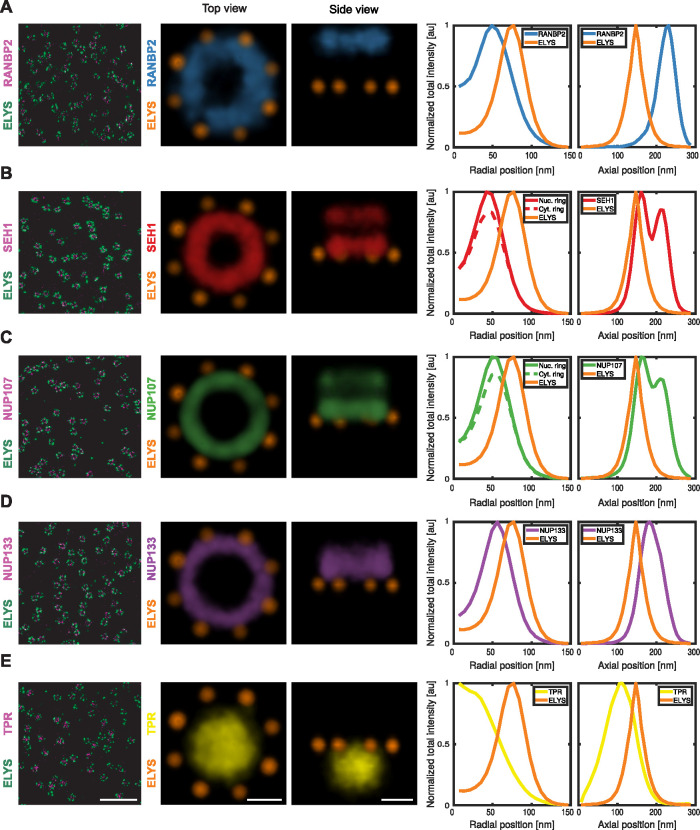
FIGURE 2:
Average intensity map of individual Nups. Representative dual-color 9-μm2 area of the lower surface of the nucleus of a U2OS cell, endogenously expressing (A) SNAP-RANBP2, (B) SNAP-SEH1, (C) SNAP-NUP107, (D) SNAP-NUP133, and (E) TPR-SNAP, respectively, labeled with BG-AF647 and with α-ELYS primary antibody and secondary coupled to CF680. Top view and side view of density maps of the 3D averages of 3D SMLM data sets (RANBP2 [n = 2140]: light blue, SEH1 [n = 1619]: red, NUP107 [n = 3617]: light green; NUP133 [n = 2418]: purple, TPR [n = 3066]: yellow and ELYS: orange). Scale bars, 1 μm for overview images and 50 nm for average intensity map.

