FIGURE 4:
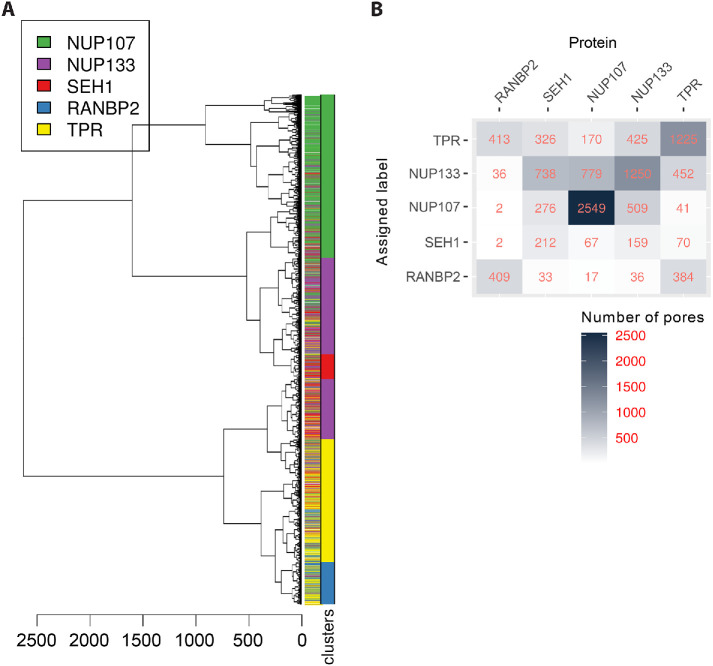
Clustering of persistence diagrams of NOIs. (A) Dendrogram of the persistent homology clustering of 10,580 3D SMLM particles representing all the NOIs. Clusters were identified by cutting the dendrogram at a height of 200 (red line), and each cluster was assigned the identity of the dominant Nup represented in it (colored bar). Although particles for each Nup tend to group together, there is some overlap with other Nups with similar structure, and the existence of distinct clusters for each Nup suggests the existence of structural diversity of the NPC (SEH1: purple; NUP107: pink; NUP133: green; RANBP2: blue; and TPR: yellow). See Materials and Methods for details on clustering. (B) Confusion matrix showing the classification outcome of the clustering scheme in A. The mean balanced accuracy is 68%.

