FIGURE 1:
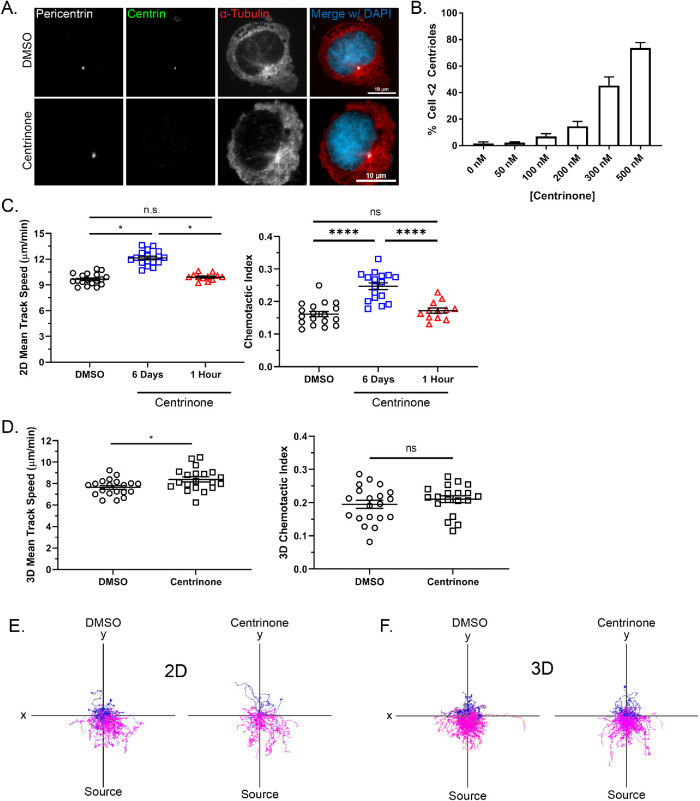
Centrinone depletes centrioles and promotes migration in neutrophil-like PLB-985 cells. (A) Representative immunofluorescence images showing centriole depletion in centrinone-treated PLB-985 cells and DMSO-treated controls. Scale bars: 10 µm. Cells were treated with centrinone for 6 days and stained for the centriole marker centrin (green) and the pericentriolar matrix marker pericentrin (white). (B) The bar graph depicts quantification of centriole depletion at the indicated concentrations of centrinone for 6 days (data displayed as mean + SD; N = 3 repeats, n = 300 cells). (C) Mean 2D track speed and chemotactic index of 500 nM centrinone- and DMSO-treated PLB-985 cells (data displayed as mean + SEM; N = 3 repeats, n = 12–18 devices, 1547–3560 cells). (D) Mean 3D track speed and chemotactic index of 500 nM centrinone or DMSO-treated dPLB-985 cells (data displayed as mean + SEM; N = 6 repeats, n = 20 devices, 8457–10,809 cells). (E) Representative track plots of cells migrating in 2D on 10 µg/ml fibronectin. Magenta tracks indicate cell tracks with a positive Y displacement toward the fMLP gradient. Blue tracks have a net negative Y displacement away from the gradient. (F) Representative track plots of cells migrating in a 1.5 mg/ml 3D collagen I matrix. Significance for both 2D and 3D migration was determined by mixed-effects REML regression with a Kenward-Rogers degrees of freedom approximation. n.s. = not significant; *, p < 0.05; ****, p < 0.0001.

