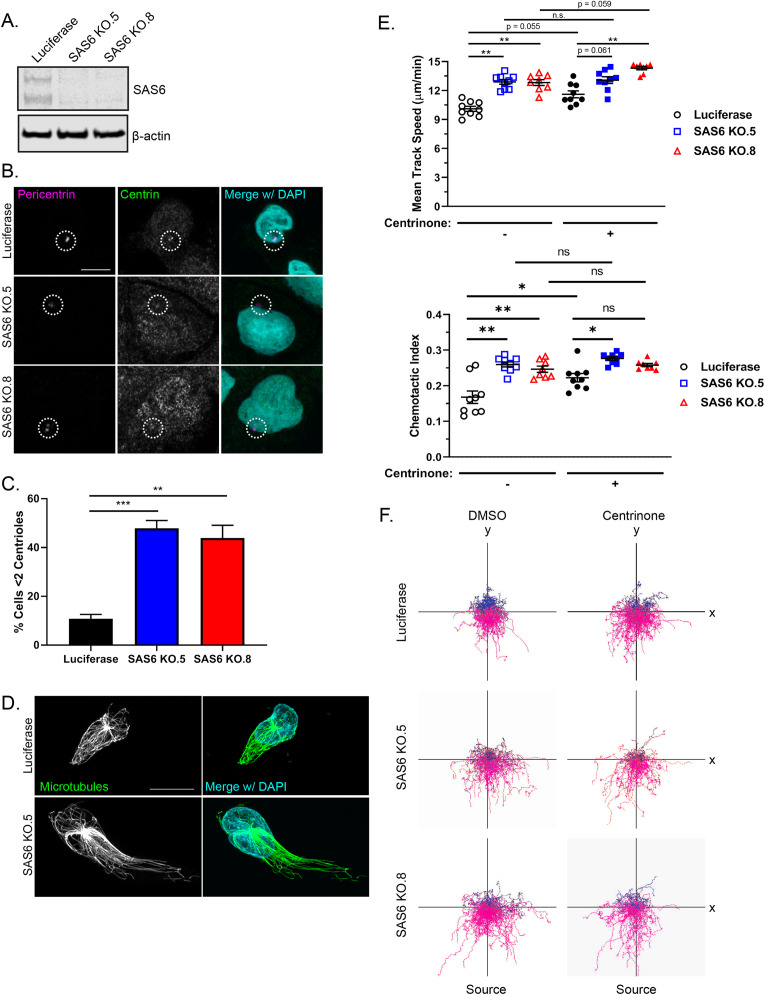
FIGURE 4:
CRISPR/Cas9 knockout of SAS6 depletes centrioles and promotes neutrophil migration. (A) Western blot of two CRISPR/Cas9 SAS6 knockout clones and CRISPR/Cas9 luciferase control. (B) Representative immunofluorescence images showing centriole depletion in SAS6 knockout clones compared with luciferase control. Cells were stained for centrin (green) and pericentrin (magenta). The white dotted circles indicate the location of the centrosome. Scale bar: 5 µm. (C) Quantification of centriole depletion in SAS6 knockout clones compared with luciferase control (data displayed as mean + SEM; N = 3 repeats, n = 230–321 cells). Significance was determined by one-way ANOVA with post hoc Dunnett’s test for multiple comparisons. (D) Representative immunofluorescence images of SAS6 KO cell compared with luciferase controls. Cells were seeded on fibronectin-coated coverslips and stimulated with 100 nM fMLP for 5 min. Cells were fixed with glutaraldehyde and stained for microtubules (green) and nuclei (blue). Scale bar: 10 µm. (E) 2D mean track speed and chemotactic index of SAS6 knockout clones compared with luciferase control ± centrinone (data displayed as mean + SEM; N = 3 repeats, n = 8–9 devices, 3875–5576 cells). Cells were imaged in a 10-µg/ml fibronectin-coated microfluidic device migrating toward an fMLP gradient every 30 s for 45 min. (F) Representative track plots of SAS6 knockout clones or luciferase control ± 500 nM centrinone. Significance was determined by mixed-effects REML regression with a Satterthwaite degrees of freedom approximation. n.s. = not significant; *, p < 0.05; **, p < 0.01; ***, p < 0.001.

