FIGURE 1:
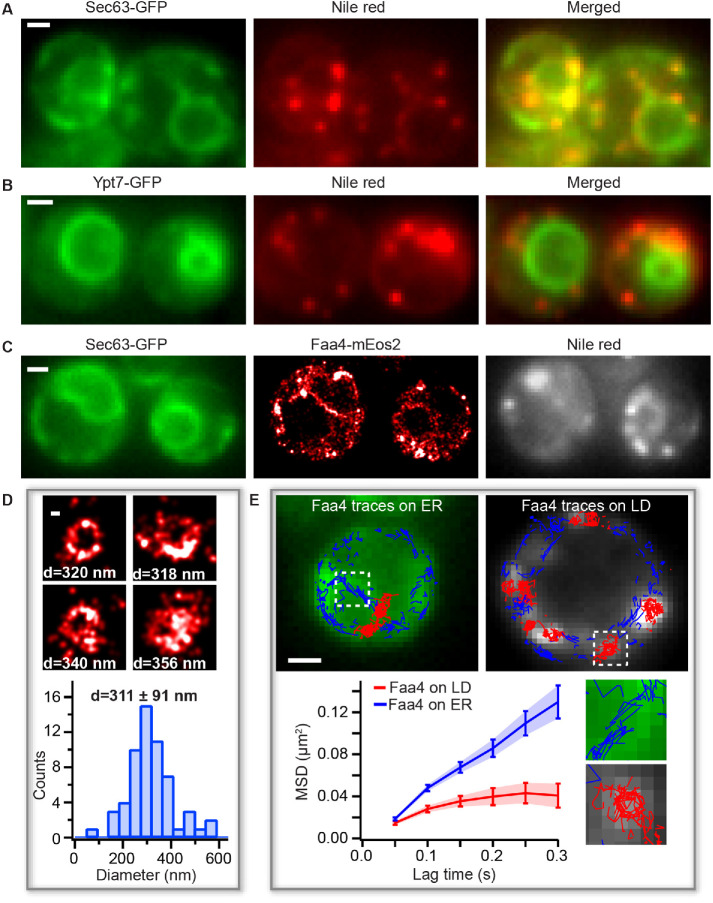
PALM reveals LD sizes and Faa4 dynamics in living cells. (A) The conventional fluorescence images of Sec63-GFP (left), Nile red (middle), and merged (right) show that LDs are colocalized with the ER in the log phase. (B) The conventional fluorescence image of Ypt7-GFP (left), Nile red (middle), and merged (right) indicate that LDs are not localized to the vacuole. (C) Conventional image of Sec63-GFP (left), PALM image of Faa4-mEos2 (middle), and conventional image of LDs stained with Nile red (right) visualize Faa4-mEos2 localizations at the ER and in dense spots that colocalize with LDs. (D) Representative images of superresolved LDs and histogram of LD diameters with a mean of 311 ± 91 nm (N = 58 LDs from 25 cells). Error represents the SD of all LD sizes. (E) Single-molecule tracking of Faa4-mEos2 superimposed on Sec63-GFP (left) and Nile red (right) reveals traces on the ER (blue) and on LDs (red). The MSD of Faa4 traces on the ER (N = 3 cells,1270 traces longer than three frames) and on LDs (N = 8 LDs from three cells, 280 traces longer than three frames) exhibit free diffusion of Faa4 at shorter lag times but confinement on LDs at longer lag times. Scale bars: 1 μm; D: 100 nm.

