FIGURE 4:
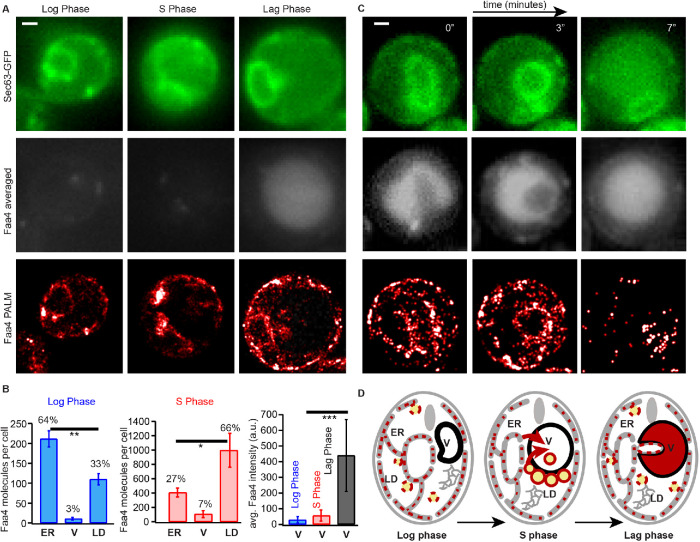
Subcellular Faa4 distribution on the ER, LDs, and the vacuole is coupled to the growth phase. (A) Sec63-GFP fluorescence in the log (top, left), stationary (top, middle) and lag phase (top, right) visualizes the ER. The averaged Faa4-mEos2 signal in the log (middle, left), stationary (middle, middle), and lag (middle, right) phases reveals an intense and diffuse Faa4 signal from the circular vacuolar region only in the lag phase. Faa4-mEos2 is similarly localized to the ER and the LDs in the log and lag phase (bottom) but mostly forms dense coats on LDs in the stationary phase. (B) The quantification of the absolute number and the percentage of Faa4 molecules that colocalized with ER, vacuole and LDs in the log (N = 14 cells) and stationary phase (N = 7 cells). Error bars represent the SE of the mean. The quantification of the average intensity counts per pixel inside the vacuole reveal that Faa4 is predominately localized to the vacuole after 2 h of dilution in fresh medium (lag phase) (N = 5 cells). (C) Time lapse shows how a portion of the Sec63-GFP signal is progressively taken inside the averaged Faa4-mEos2 signal, which indicates that a part of the ER is taken inside vacuole after 30 min of dilution in fresh medium. (D) Schematics showing localization and redistribution of Faa4 among the ER, LDs, and the vacuole in the log, stationary and lag phase. Scale bars: 1 μm. Asterisks indicate statistical significance from t test (*p ≤ 0.05, **p ≤ 0.005, ***p ≤ 0.0005).

