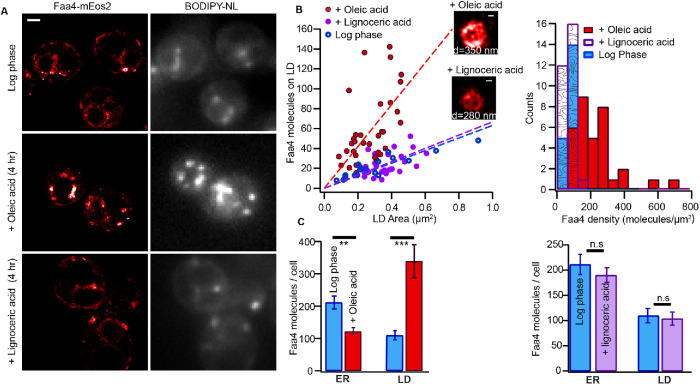
FIGURE 5:
The subcellular distribution of Faa4 and density on LDs is dependent on the carbon chain length of exogenously added fatty acids. (A) Faa4-mEos2 PALM and BODIPY-NL image of yeast cells grown to log phase (top). Faa4 is localized to the ER and to a few LDs as confirmed by the BODIPY-NL signal. In the presence of oleic acid (C18), a higher number of LDs per cell is observed and Faa4 predominately localizes to LDs (middle). The Faa4 and LD distribution in the presence of lignoceric acid (C24) resembles that of the log phase (bottom). (B) Area of individual LDs vs. the number of Faa4 molecules on LDs surface from cells in the log phase and in the presence of oleic acid and lignoceric acid (left). Histogram of surface densities of Faa4 on individual LDs (right). (C) Quantification of the number of Faa4 molecules per cell localized to the ER and LDs in the log phase (N = 14 cells) and in the presence of oleic acid (left) (N = 20 cells) and in the presence of lignoceric acid (right) (N = 17 cells). Error bars represent the SE of the mean. Scale bar: 1 μm; zooms: 100 nm. Asterisks indicate statistical significance from t test (**p ≤ 0.005, ***p ≤ 0.0005).

