FIGURE 1:
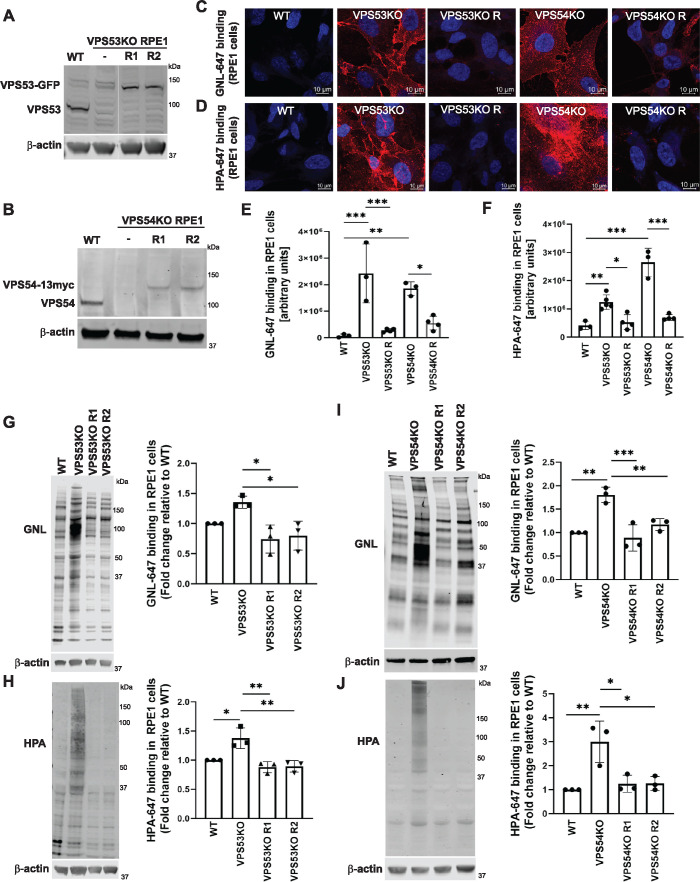
GARP-KO results in Golgi glycosylation defects in RPE1 cells. (A) WB of RPE1 cell lysates from WT, VPS53-KO, and two VPS53-KO rescued clones expressing VPS53-GFP (R1 and R2) probed with anti-VPS53 antibody. (B) WB of RPE1 cell lysates from WT, VPS54-KO, and two VPS54-KO clones rescued with VPS54-13myc (R1 and R2) probed with anti-VPS54 antibodies. (C) Staining of nonpermeabilized WT, VPS53-KO, and VPS54-KO RPE1 cells, and the corresponding rescued cells with the fluorescently conjugated lectin GNL-647 (specific for terminal α-D-mannosyl residues). (D) Staining of nonpermeabilized WT, VPS53-KO, and VPS54-KO RPE1 cells and the corresponding rescued cells with the fluorescently conjugated lectin HPA-647 (specific for terminal GalNAc residues). (E) Quantification of GNL-647 binding was done on the basis of the total GNL-647 signal per field. Three different fields were used for the quantification of GNL-647 binding and each field included approximately 80 cells. The y-axis in the bar graph represents relative binding of GNL-647 to the surface of WT, GARP-KOs, and rescued RPE1 cells in arbitrary units. Bar graphs with error bars represent mean ± SD. (F) Quantification of HPA-647 binding was done on the basis of the total HPA-647 signal per field. Bar graphs with error bars represent mean ± SD from three different fields. The y-axis in the bar graph represents relative binding of HPA-647 to the surface of WT, GARP-KOs, and rescued RPE1 cells in arbitrary units. (G, H) GNL-647 and HPA-647 staining of total proteins from WT, VPS53-KO, and two rescue clones of RPE1 cells (left panels) and quantification from three independent experiments (right panels). Values in bar graphs represent the mean ± SD from three independent experiments. (I, J) GNL-647 and HPA-647 staining of total proteins from WT, VPS54-KO, and two rescue clones of RPE1 cells (left panels) and quantification from three independent experiments (right panels). Values in bar graphs represent the mean ± SD from three independent experiments. Statistical significance was calculated in GraphPad Prism 8 using one-way ANOVA. ***P ≤ 0.001, **P ≤ 0.01, *P ≤ 0.05.

