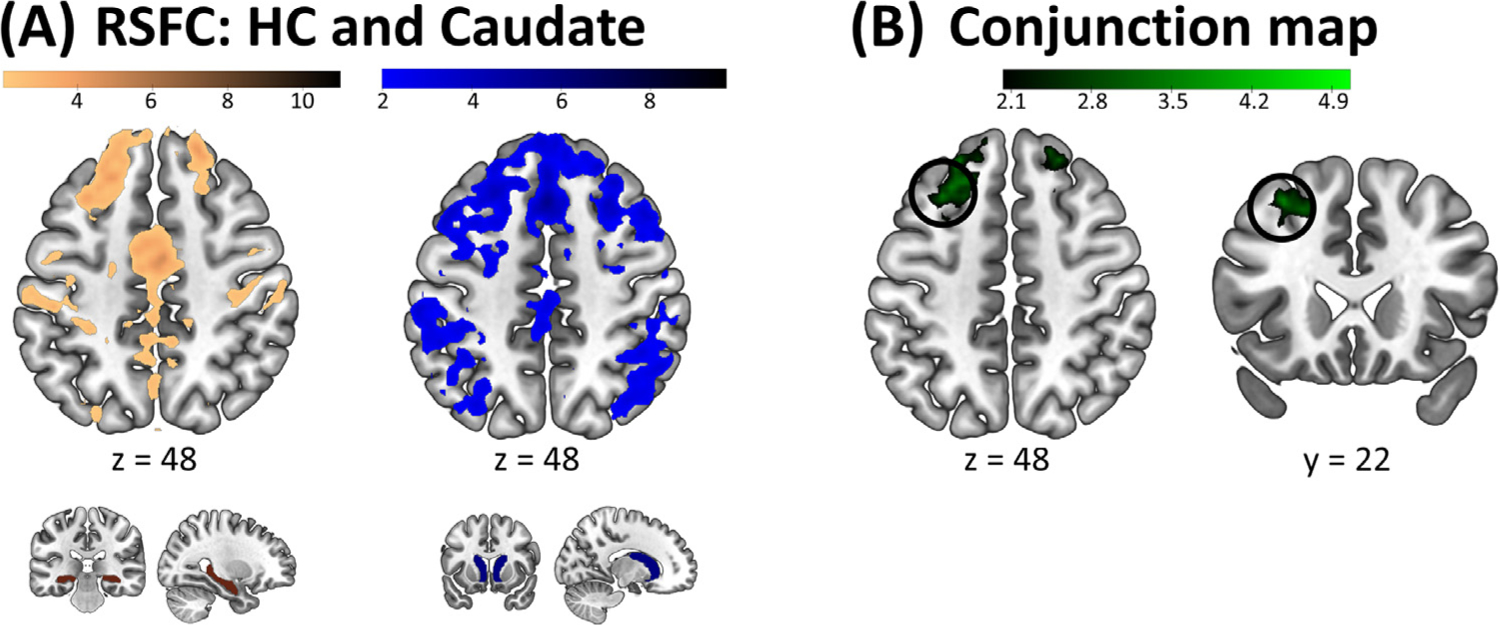
Fig. 2.

Group target identification on an independent RS fMRI dataset. (A) Resting State Functional Connectivity (RSFC) maps of the hippocampus (HC, left panel) and the caudate nucleus (right panel). The respective seeds are depicted below the connectivity maps. See Supplemental Table S5 for the complete list of clusters. (B) Conjunction map between the HC and Caudate RSFC maps (displayed within a frontal mask). A 15-mm radius sphere (depicted as a black circle) centered around the peak maxima (−30 22 48 mm) was used as search area for individualized targeting in the current experiment. See Supplemental Table S6 for a list of prefrontal clusters identified in the conjunction analysis and Supplemental Table S7 and Supplemental Fig. S1 for individual TMS targets of the current experiment. Connectivity maps and RSFC seeds are displayed on a T1-weighted template image with a threshold of pFDR < .05 for the connectivity maps. Color bars represent Z values.
