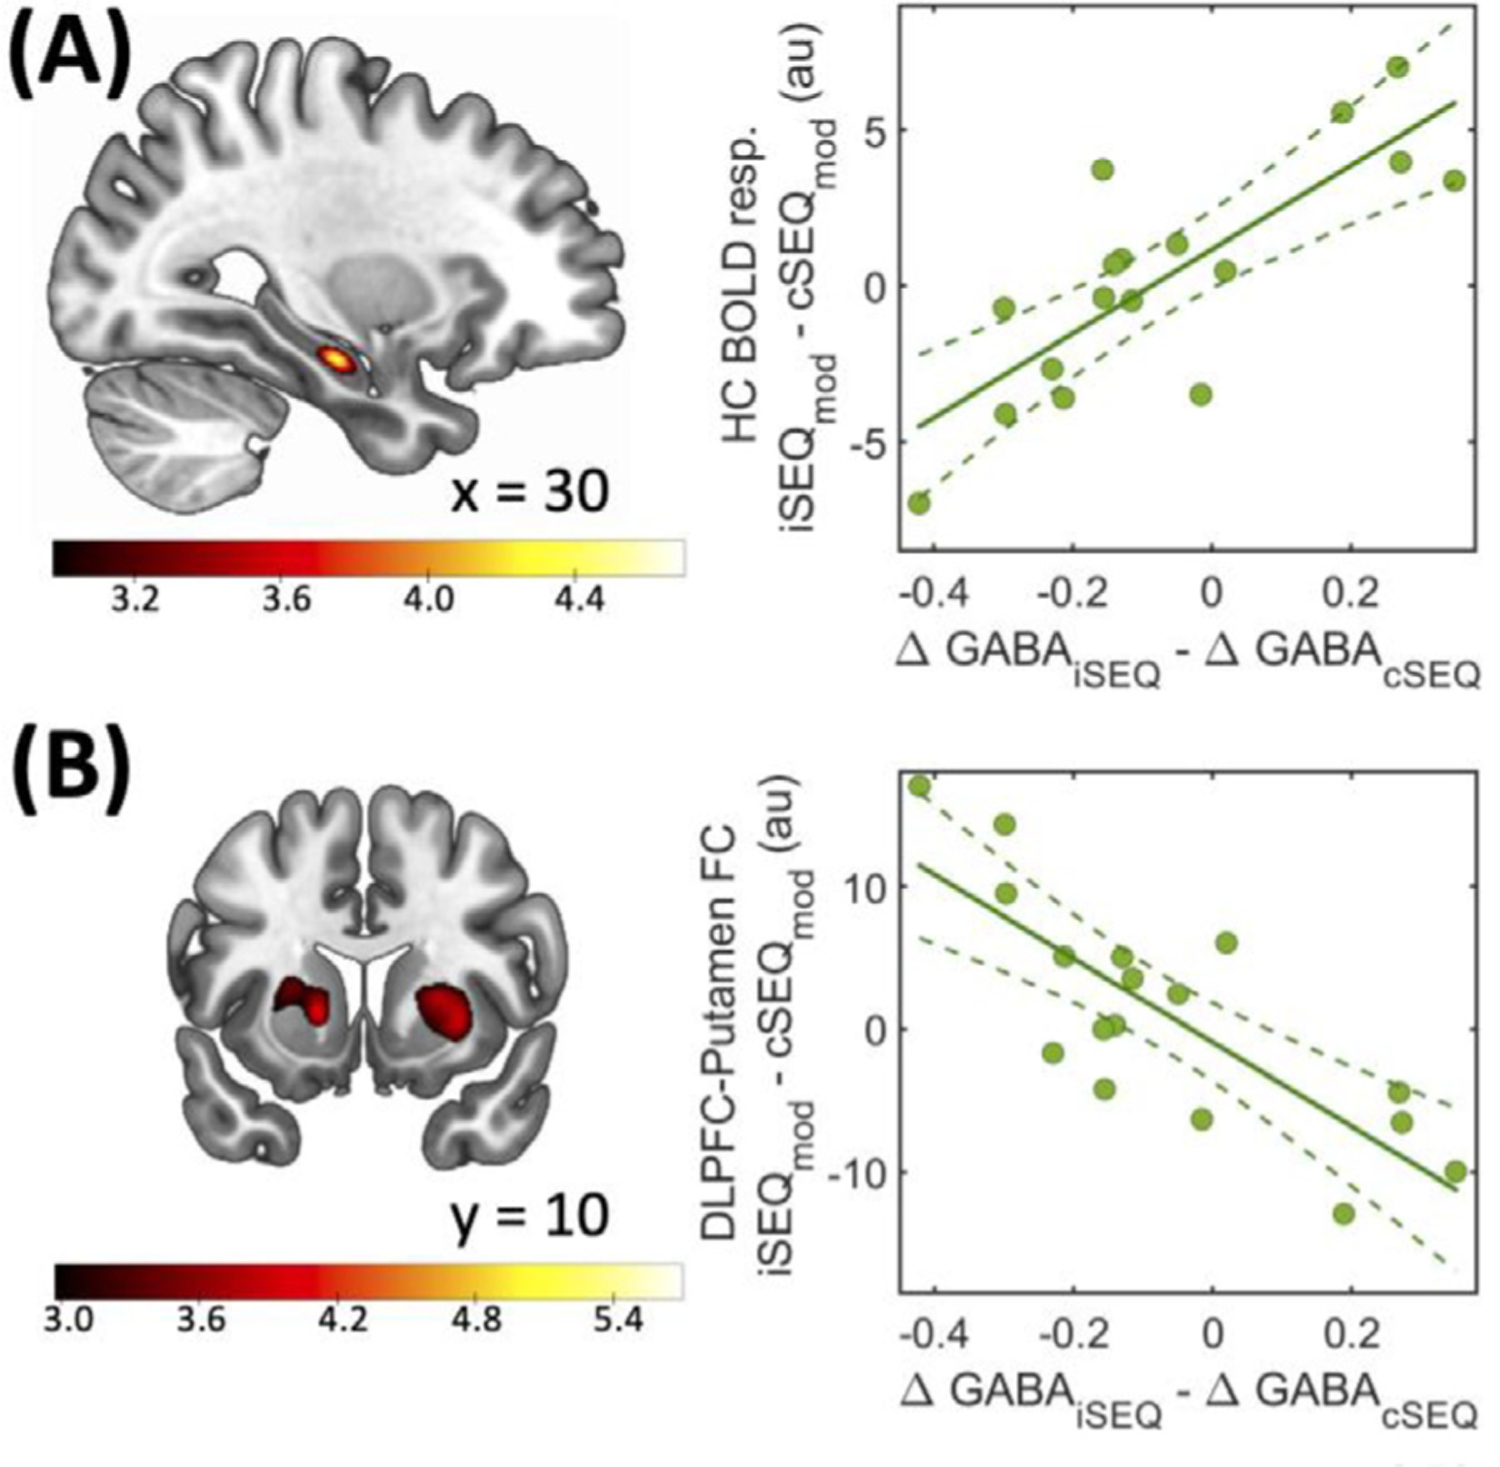
Fig. 5.

Regressions with DLPFC ΔGABA. (A) Hippocampal (HC) dynamical activity during learning (30 −16 −18 mm, left panel) was differently related to DLPFC ΔGABA between conditions. (B) Learning-related changes in DLPFC-putamen functional connectivity (FC) patterns (20 4 −6 mm, left panel) were differently related to DLPFC ΔGABA between conditions. Regression maps are displayed on a T1-weighted template image with a threshold of p < .005 uncorrected. Color bars represent T values. Circles represent individual data, solid lines represent linear regression fits, dashed lines depict 95% prediction intervals of the linear function. au: arbitrary units, resp.: response, i: intermittent, c: continuous, SEQ: sequence, mod: modulation contrast, GABA = gamma-aminobutyric acid.
