
Fig. 6.
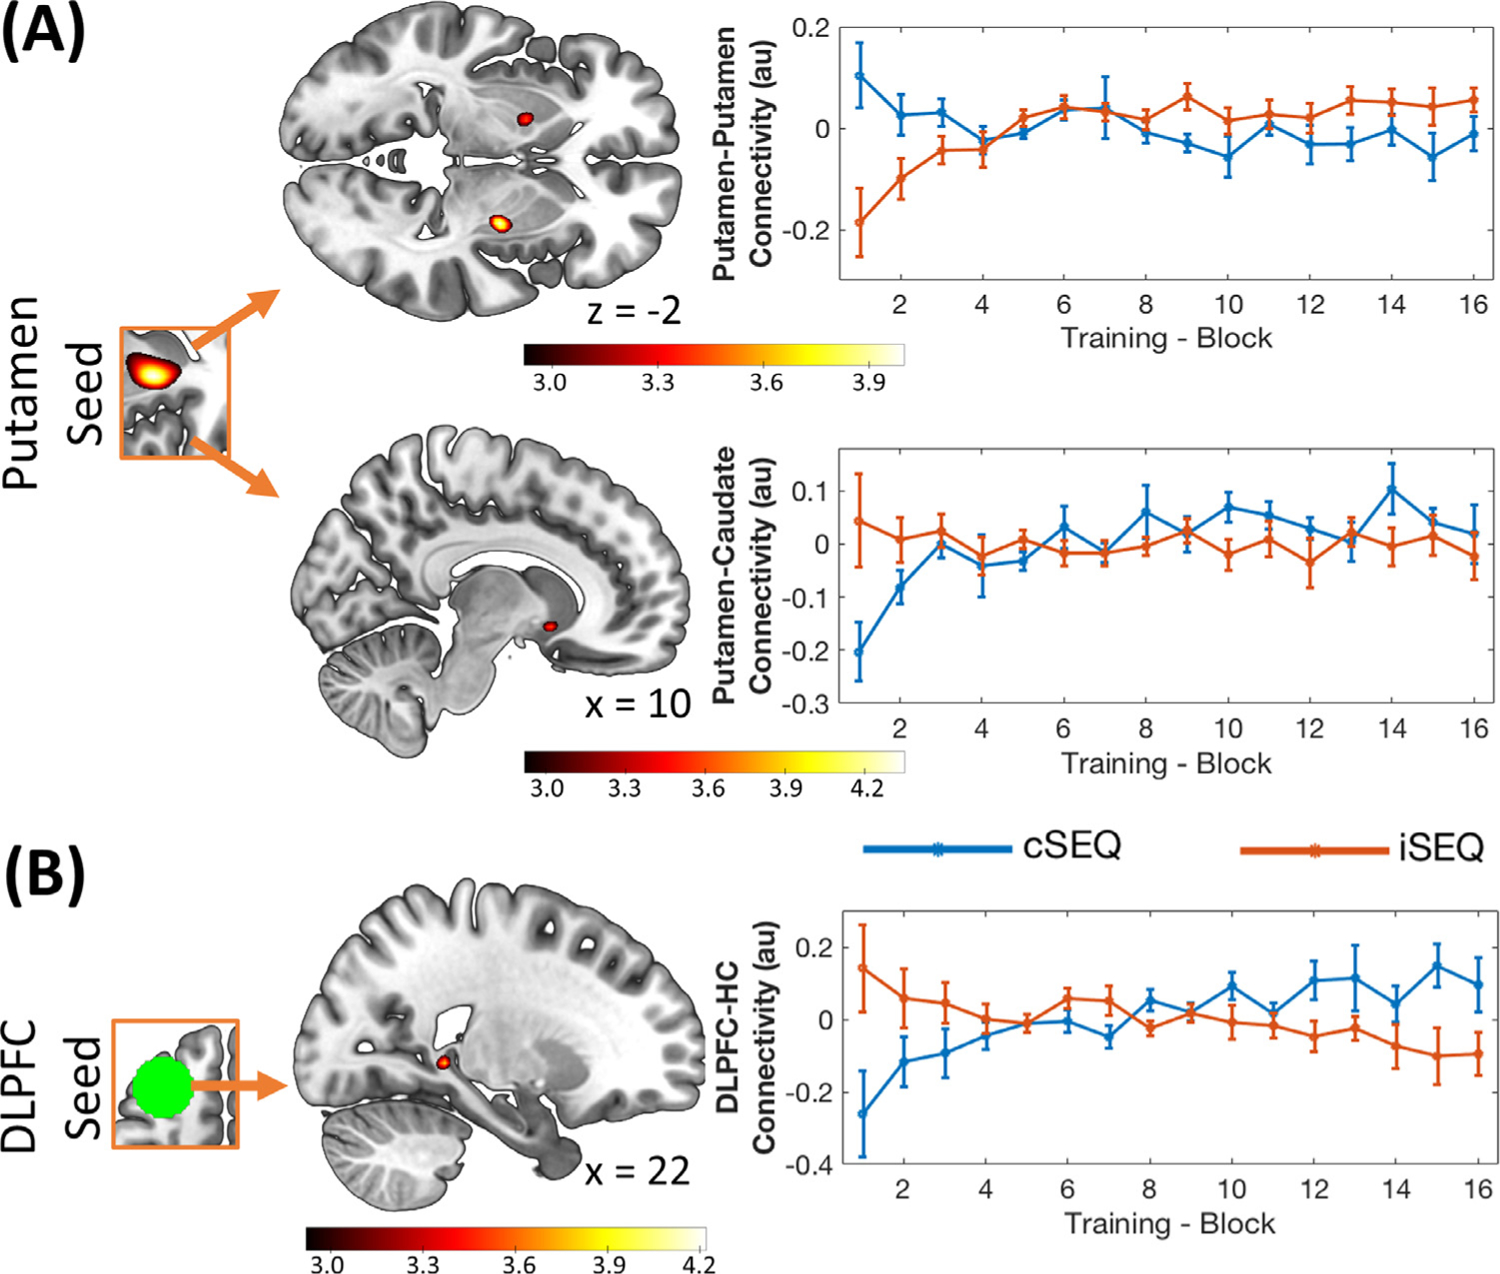
Stimulation effect on sequence (SEQ) task-related connectivity. (A) Functional connectivity (FC) between the right putamen and the sensorimotor putamen (28 −8 −2 mm, upper panel) increased more as a function of learning after iTBS compared to cTBS. FC with the caudate nucleus (10 12 −8 mm, lower panel) showed the opposite pattern. (B) FC of the DLPFC TBS target with the hippocampus (HC, 22 −40 0 mm) increased more as a function of learning in the cTBS as compared to the iTBS condition. Connectivity maps are displayed on a T1-weighted template image with a threshold of p < .005 uncorrected. Color bars represent T values. Error bars indicate SEM. au: arbitrary units, TBS: theta-burst stimulation, i: intermittent, c: continuous.