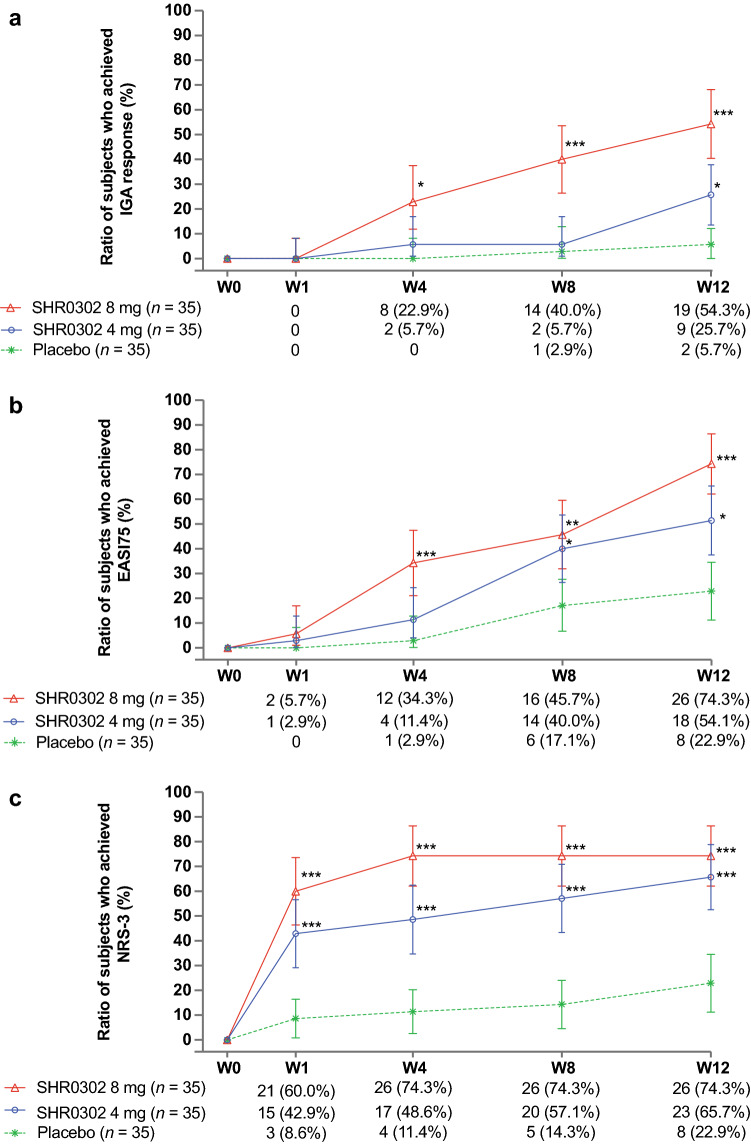
Fig. 2.
Line plots for proportions of patients who achieved a IGA response, b EASI75, and c NRS-3 (FAS). Two subjects in the placebo group had baseline NRS <3, therefore these two subjects would not show an improvement of ≥3 from baseline. The denominator of each treatment group was the number of subjects in the FAS of each treatment group. EASI Eczema Area and Severity Index, FAS full analysis set, IGA Investigator’s Global Assessment, NRS Numerical Rating Scale, W week. *p < 0.05, **p < 0.01, ***p < 0.001

