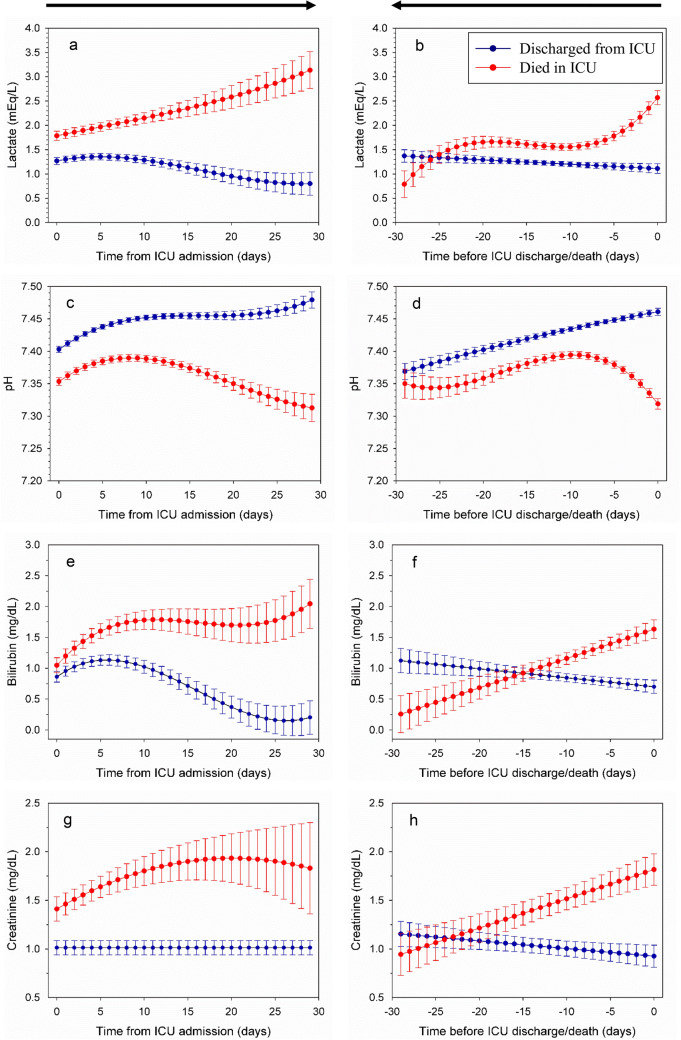
Fig. 2.
Time course of physiological variables during ICU stay according to the patient's outcome life status at discharge obtained by a polynomial maximum likelihood multilevel model with a random intercept at the patient level and random slope at the time level (see text for description of the model). a and b Lactate; c and d pH; e and f bilirubin; g and h creatinine. Dots represent data from the overall models, error bars represent 95% confidence interval of the model. Blue color represents patients discharged from ICU while red color represents patients died in ICU. The analysis was performed in two ways: (1) temporal trends were modeled from ICU admission (day 0) up to 30 days or ICU discharge/death (left panels a, c, e, g); (2) the time scale was adjusted by subtracting each patient’s ICU discharge/death time (day 0) back to a maximum of 30 days (right panels b, d, f, h)

