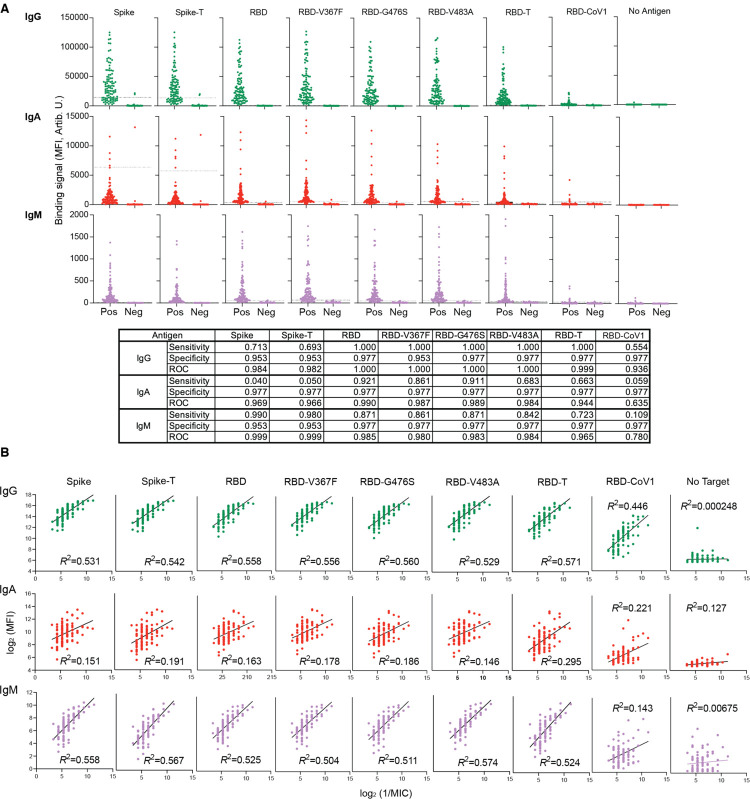
Figure 2.
2D-MBBA data for convalescent (positive) and pre-COVID (negative) samples and the diagnostic performance of individual datasets.
(A) Raw 2D-MBBA readouts of IgG, IgA and IgM levels for the indicated antigens of convalescent (“Pos”) and pre-COVID (“Neg”) samples. For each isotype-antigen pair, sensitivity and specificity for detecting positivity were calculated with cut-off values set at the mean + 3 × s.d. of the pre-COVID data. The ROC values denote the area under the curve for the ROC curves (ROC curves are included in Supplementary Data Table 1).
(B) 2D-MBBA data for the convalescent sera plotted versus neutralization titer after log2 transformation. Note that the negative control data are not included, in order to critically evaluate the correlation of each isotype-antigen pair with neutralization.

