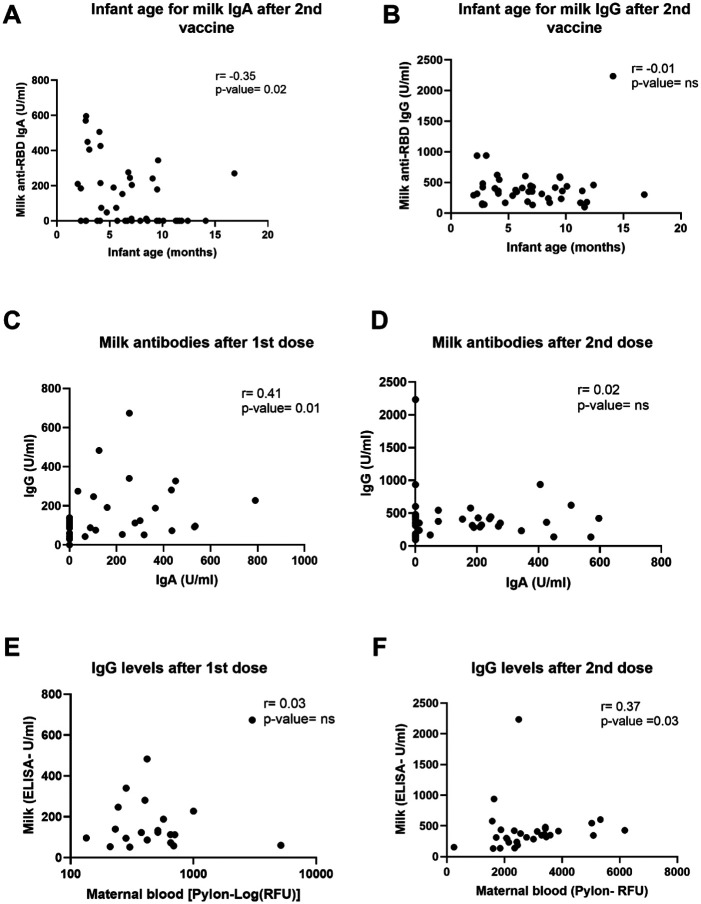
Figure 4: Correlations between milk antibodies, blood antibodies and infant age.
Two-tailed Spearman correlation was used to correlate milk IgA (A) and IgG (B) levels (Y axis) and infant age (X axis) 4–10 weeks after the 2nd dose administration (n=30). In addition, two-tailed Spearman correlation was used to correlate milk IgG (Y axis) and milk IgA levels (X axis) on the day of 2nd dose administration(C), 21–28 days after 1st dose (n=35) and and 4–10 weeks after 2nd dose (D). We also tested correlation between milk (Y axis) and maternal plasma (X axis) IgG levels at day of 2nd dose (E) and 4–10 weeks after the 2nd dose administration (F) (n=30). Semi-partial correlations were used to assess relationships between variables while controlling for the effects of other relevant variables.

