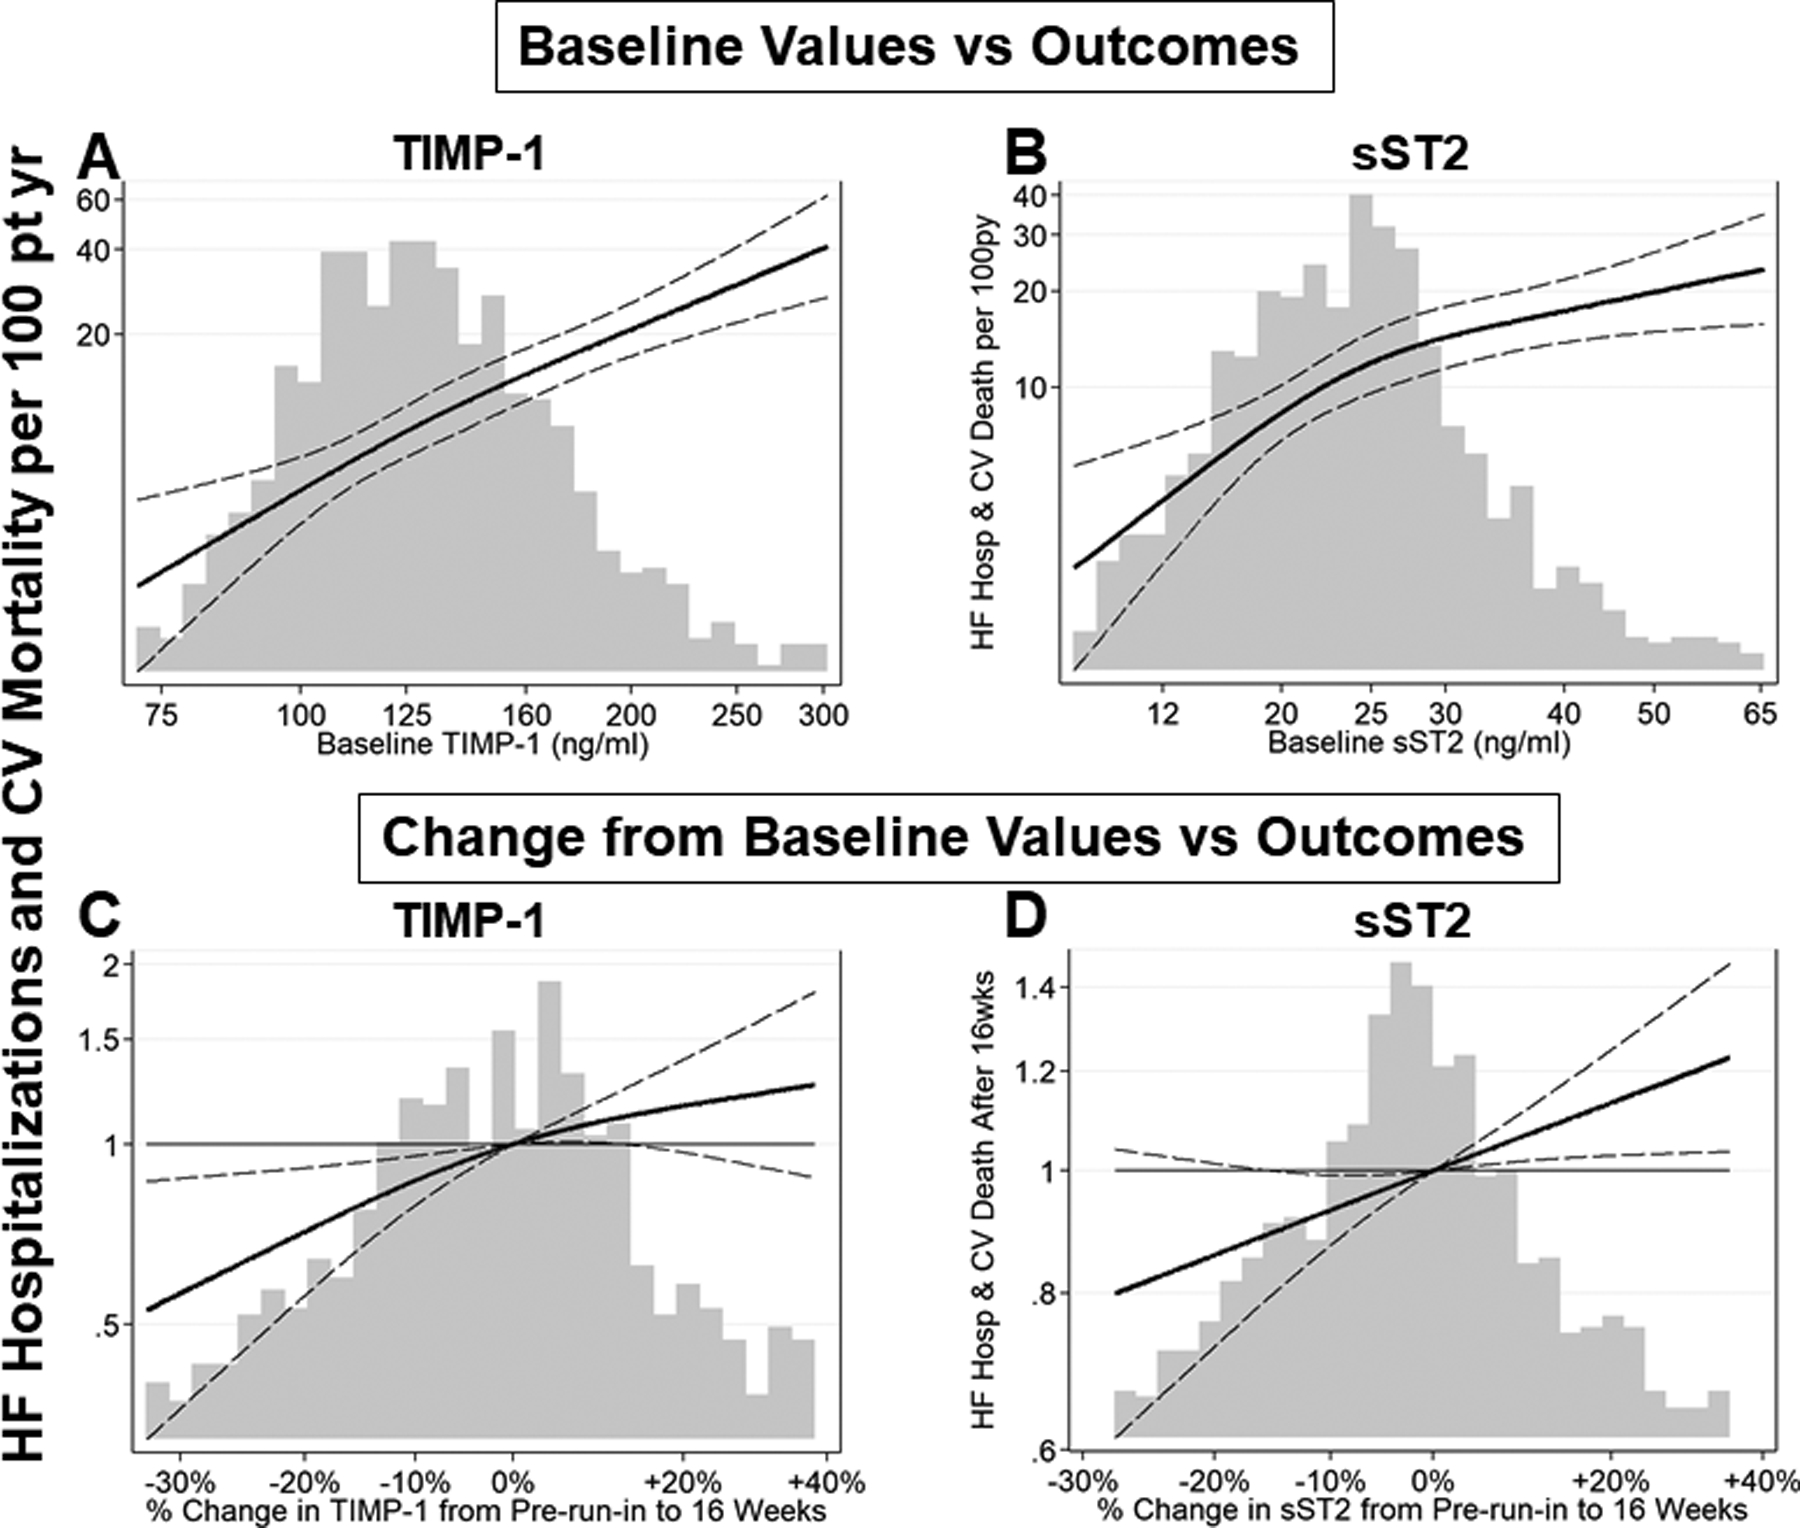
Figure 6. Prognostic value of biomarker data from PARAGON-HF Study59.

Biomarkers that reflect mechanisms that increase procollagen synthesis, such as soluble ST2, are increased in HFpEF patients; biomarkers that reflect mechanisms that decrease collagen degradation, such as increased tissue inhibitor of matrix metalloproteinase-1 (TIMP-1) are increased in HFpEF patients. Both baseline and change from baseline levels of these profibrotic biomarkers provide prognostic value. Continuous relationships of TIMP-1 and sST2 baseline values and 16-week change from baseline values with incidence of subsequent heart failure (HF) hospitalization and cardiovascular (CV) death are plotted.
(A, B) The x-axis and histogram represent plasma biomarker level at baseline. The solid line represents estimated incidence rate of the primary endpoint, total HF hospitalizations and CV death. The dashed lines represent 95% confidence intervals for the estimated incidence rate. Incidence rate is displayed on the primary (left-sided) y-axis.
(C, D) The x-axis and histogram represent change in biomarker level between pre-run-in baseline visit and the week 16 visit. The solid line represents estimated incidence rate of the primary endpoint, total HF hospitalizations and CV death, that occurred after 16 weeks, relative to patients with no change in biomarker level, adjusted for log-transformed baseline value. The dashed lines represent 95% confidence intervals for the estimated incidence rate. Incidence rate ratio is displayed on the primary (left-sided) y-axis.
The higher the baseline value of TIMP-1 and sST2, the higher the rate of HF hospitalization and CV mortality. Over 16 weeks follow-up if TIMP-1 or sST2 decreased, the primary endpoints decreased.
