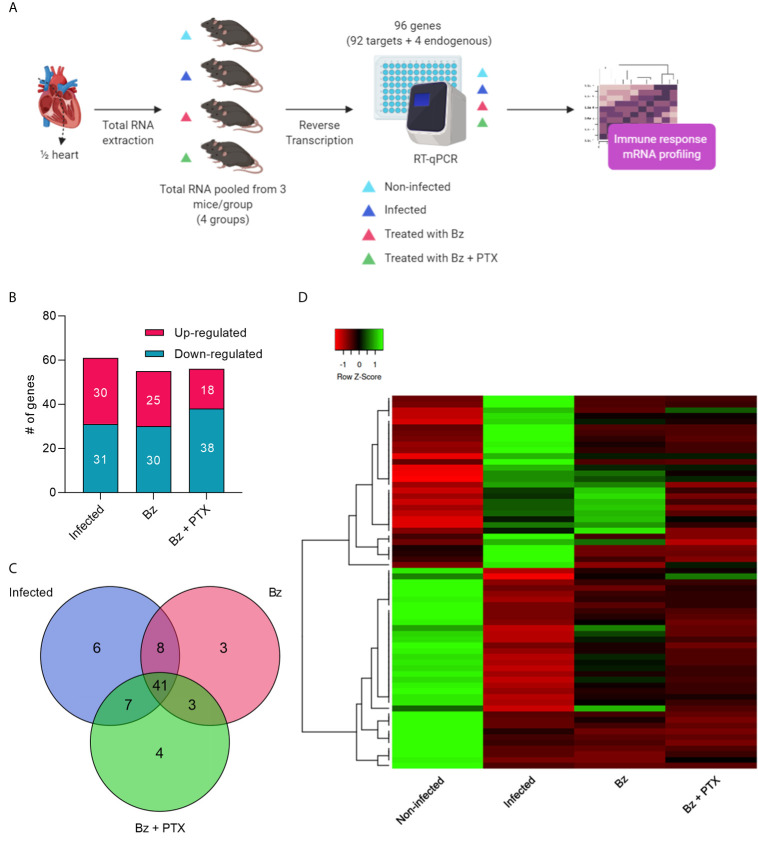
Figure 2.
Overview and characterization of immune array analysis. (A) Schematic design of array workflow. Mice cardiac tissues were harvested 30 days after therapy and ½ of the heart was submitted to total RNA extraction, subsequent reverse transcription, and RT-qPCR of 92 immune-related genes (92 targets + 4 endogenous controls). (B) Number of altered genes in each group. (C) Venn diagram showing the number of altered expressed genes in each group. (D) Heatmap and hierarchical clustering. The color scale illustrates gene’s fold change after global normalization; red represents −1 to 0 and green is 0 to 1. Clustering was performed using average linkage distance measurement method: Spearman Rank correlation. #: number.

