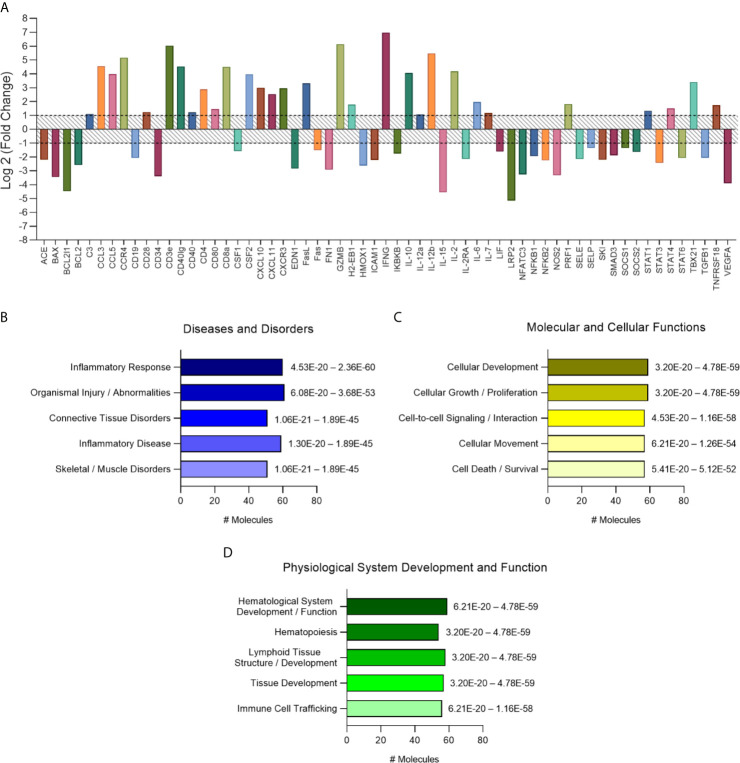
Figure 3.
Characterization of immune response expression profile for the chronically infected group. (A) Overall expression of the altered immune response genes found in this study. Results were expressed as Log2 (Fold Change) and genes with fold change values under -1 (fold change 0.5) and over 1 (fold change 2) were considered altered and used for further analysis on IPA software. (B) Diseases and disorders pathway analysis. (C) Molecular and Cellular Function pathway analysis. (D) Physiological System Development and Function pathway analysis. Significance interval of enrichment is shown on the right of the bars. #: number.

