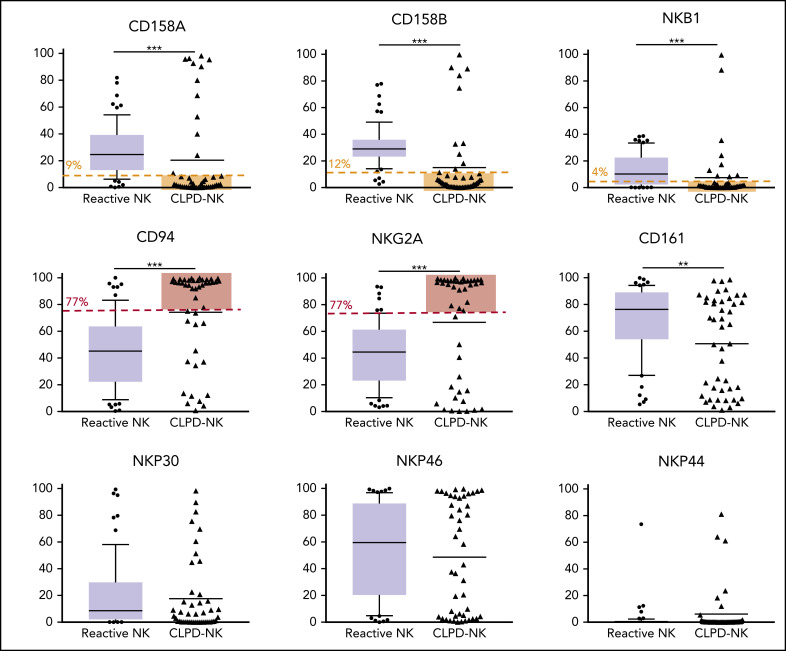
Figure 1.
Flow cytometry analysis of NK receptors in the CLPD-NK and reactive NK groups. In the reactive NK group, the expression distribution of each FCM marker is represented by a box plot. The whiskers correspond to the 10th to 90th percentiles. Individual CLPD-NK samples are plotted as triangles. The optimal cutoff defined with the analysis of ROC curves for the NK-cell clonality score are plotted in red for overexpressed antigens or in yellow for underexpressed antigens. Comparisons were performed with the Mann-Whitney U test.

