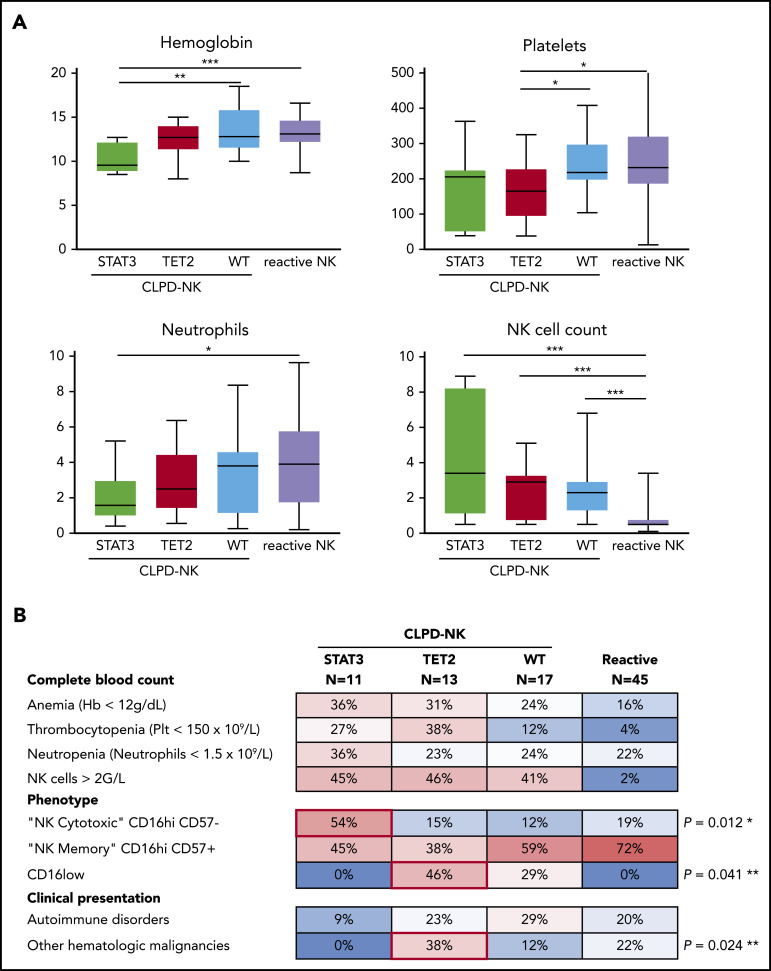
Figure 3.
Clinical and phenotypical characteristics of patients according to mutational status. (A) Comparison of complete blood count parameters according to the mutational profile (Mann-Whitney U test). (B) A heat map of the prevalence (percentage) of cytopenia, phenotypical profile, and associated events in patients with CLPD-NK or reactive NK cell proliferation. *P for STAT3-mutated vs the other 2 CLPD-NK groups; **P for TET2-mutated vs the other 2 CLPD-NK groups comparisons (Fisher’s exact test).

