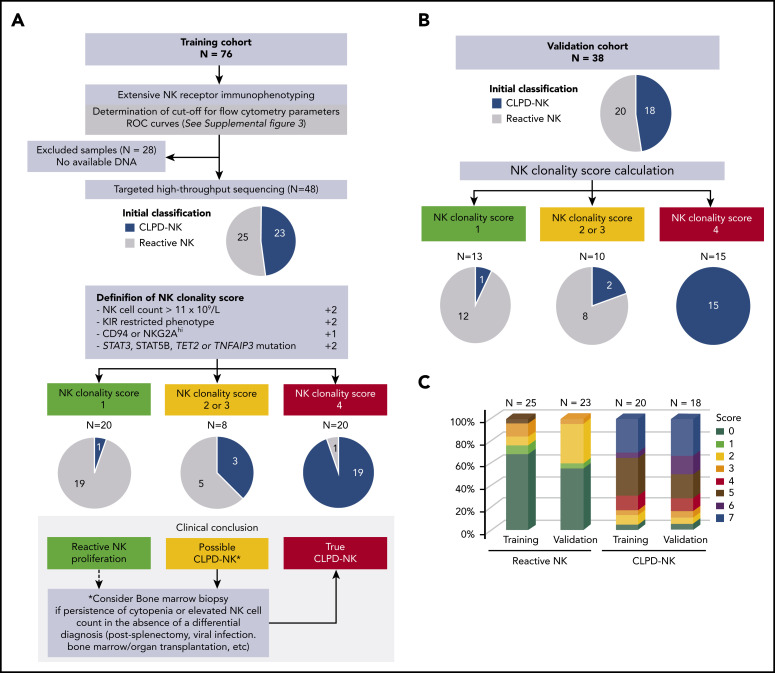
Figure 4.
NK-cell clonality score. (A) Flowchart for NK-cell clonality score development based on the training set data (n = 76). The pie charts show the distributions of patients in CLPD-NK (blue) vs reactive NK group (gray) according to standard criteria. Comparison with final assessment according NK-cell clonality score. (B) Validation of NK-cell clonality score on an independent set of patients. (C) Distribution of the NK-cell clonality score between the 2 groups.

