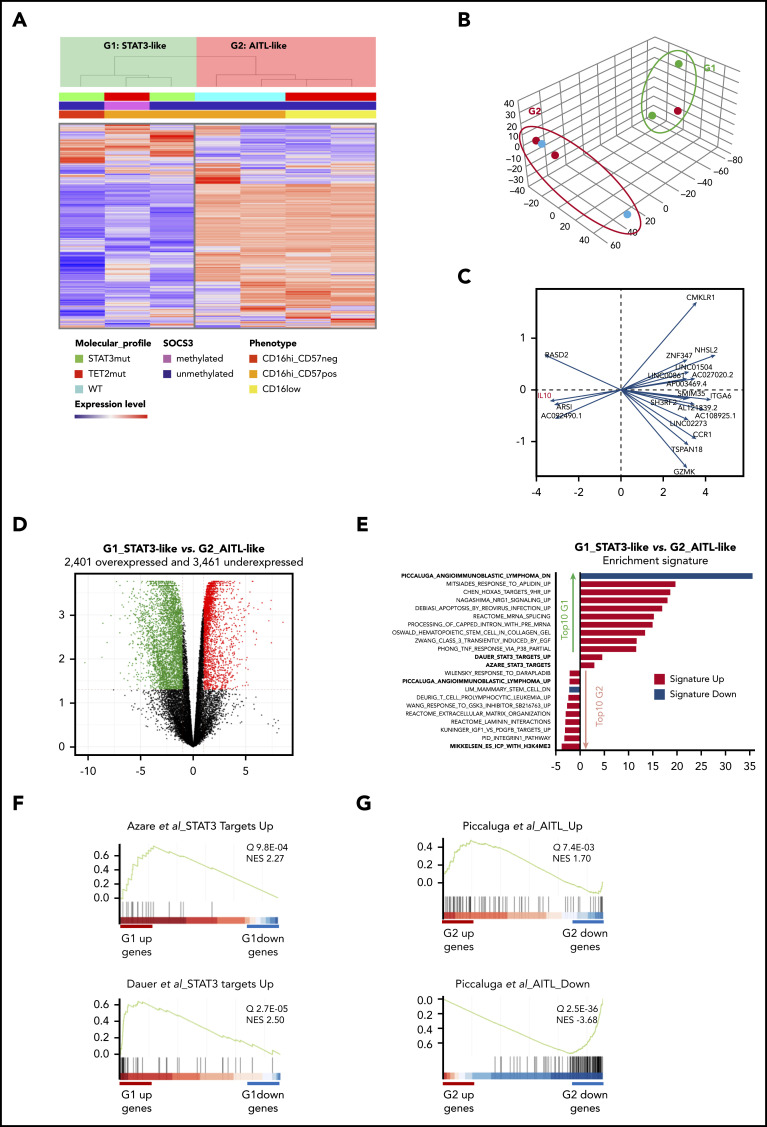
Figure 7.
Transcriptional analysis by RNA-sequencing of 7 patients with CLPD-NK. (A) Hierarchical clustering (A) and PCA (B) performed on the 1000 most variable genes of the data set. Samples are clustered into 2 groups (G1 vs G2). (C) PCA gene contribution. (D) Volcano plot representing the significantly overexpressed (red) and underexpressed (green) gene in G1 vs G2 group (q > 0.05; fold change >2). (E) GSEA: STAT3-targets related signatures and top 10 overrepresented signatures among the differentially expressed genes in G1 vs G2, ranked by q value. (F) GSEA plot for STAT3 target signatures in G1. (G) GSEA plot for AITL signature in G2. NES, normalized enrichment score.

