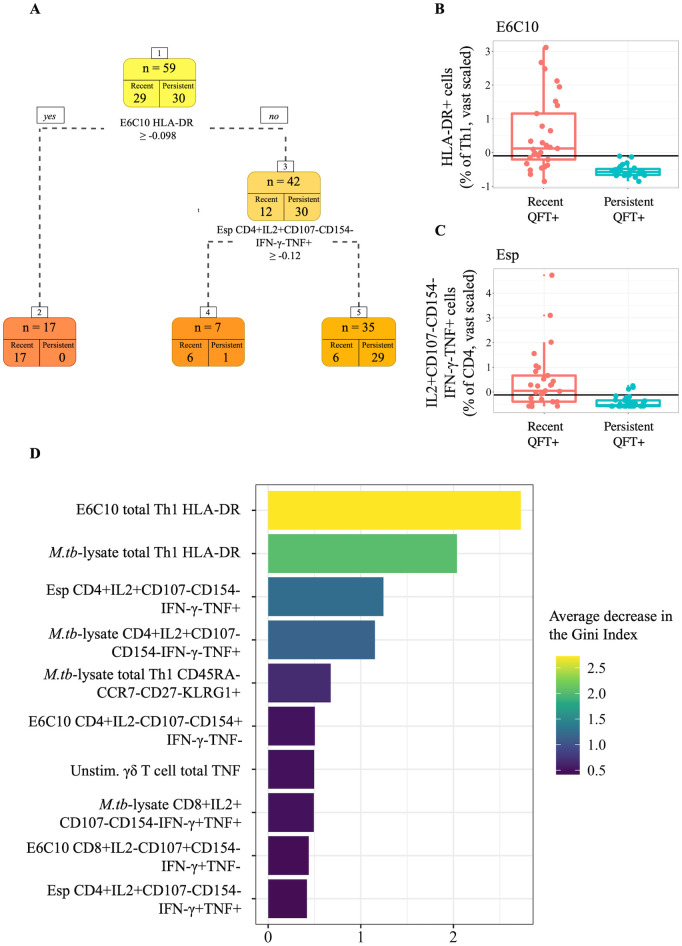
Fig 3. Tree-based modeling results.
(A) Results from the simple classification tree built to the entire integrated dataset. Boxplots comparing vast scaled values of recent (red) and persistent (blue) QFT+ individuals were plotted for the two most stratifying features identified by the decision tree. The split values are superimposed onto the plots at (B) -0.098 for proportions of E6C10-specific Th1 cells expressing HLA-DR, and (C) -0.12 for frequencies of Esp-specific IL2+CD107-CD154-IFN-γ-TNF+ CD4+ T cells. (D) Variable importance plot of the final RF model showing the top 10 variables that resulted in the largest average decrease in the Gini Index.

