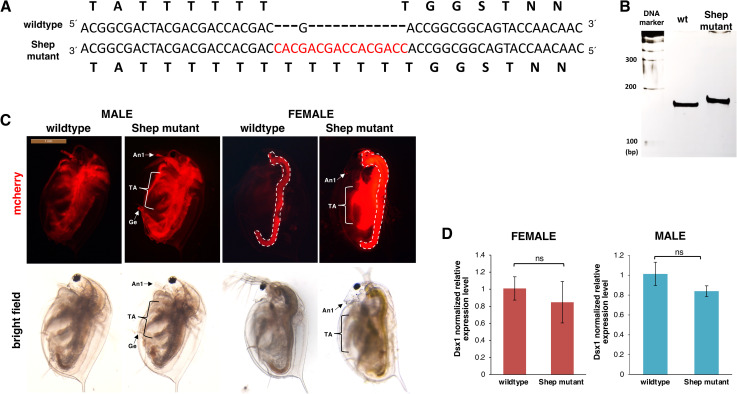
Fig 3. Generated Shep mutant line.
(A) Nucleotide and amino acid sequence comparison between wildtype and Shep mutant. (B) PAGE analysis of PCR products by genomic PCR to amplify the Cas9/gRNA targeting region in the Shep coding sequence in the Shep mutant line. (C) Lateral view of the 2w Shep male and female mutant lines showing increase in mCherry fluorescence. The red signal from the guts (dotted lines) represents the autofluorescence of Chlorella, the main food used in daphniid cultivation. An1: first antennae, TA: thoracic appendages, Ge: genital. (D) Gene expression profile of Dsx1 in 1w female and male wildtype control and Shep-. RT-qPCR results are shown as expression levels normalized with housekeeping genes L32, L8 and Cyclophilin and relatively compared to the wildtype control. Error bars indicate the standard error of the mean (n = 3). ns: not significant (Student’s T-test).

