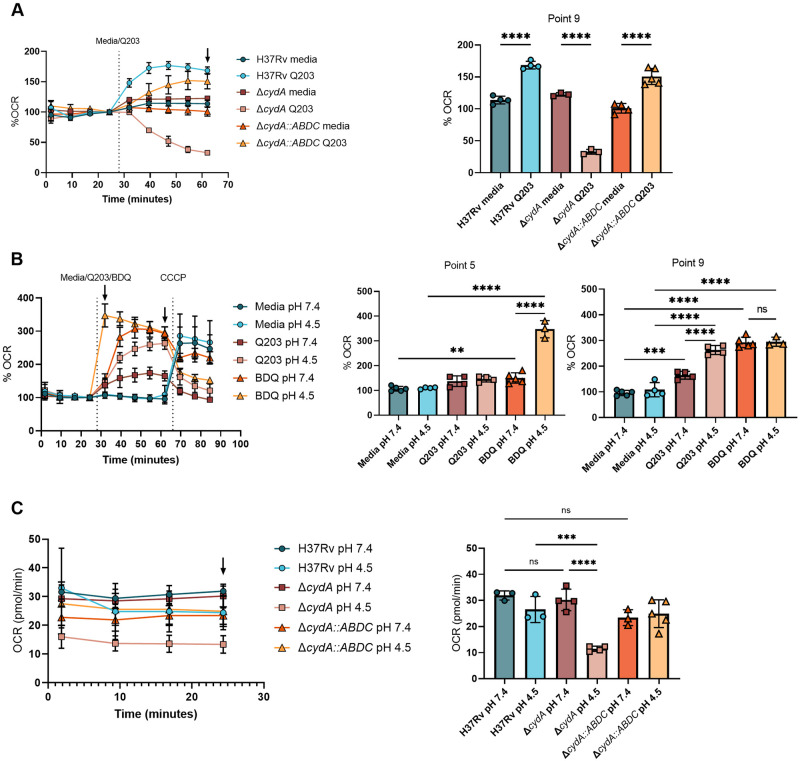
Fig 4. The bd oxidase is necessary for optimal respiration under low pH conditions.
Oxygen consumption rate (OCR) was measured using the extracellular flux analyser. A) H37Rv, ΔcydA and ΔcydA::ABDC strains were exposed to media at pH 7.4 for ~30 minutes and then treated with Q203 (10nm) at the indicated time. Data are normalized to point 4. Bar graph of point 9 (black arrow). B) H37Rv was exposed to media at pH 7.4 and pH 4.5 for ~30 minutes and then treated with media, Q203 (300x MIC50 900nM), or BDQ (300x MIC50 16.2uM) followed by the uncoupler, CCCP, at the indicated times. Data are normalized to point 4. Bar graphs are plotted from point 5 and point 9 (black arrows in A) after the addition of BDQ/Q203 and before the addition of CCCP, respectively. C) OCR measurements (pmol O2/min) of H37Rv, ΔcydA and ΔcydA::ABDC strains after ~30 minutes pre-exposure to media at pH 7.4 or pH 4.5. Bar graphs are plotted from point 4 (black arrow). Analysis was performed using a one-way ANOVA with Tukey post-test. * p-value < 0.05, ** p-value < 0.01, **** p-value <0.0001. Data depict single experiments that are representative of at least 2 independent studies.

