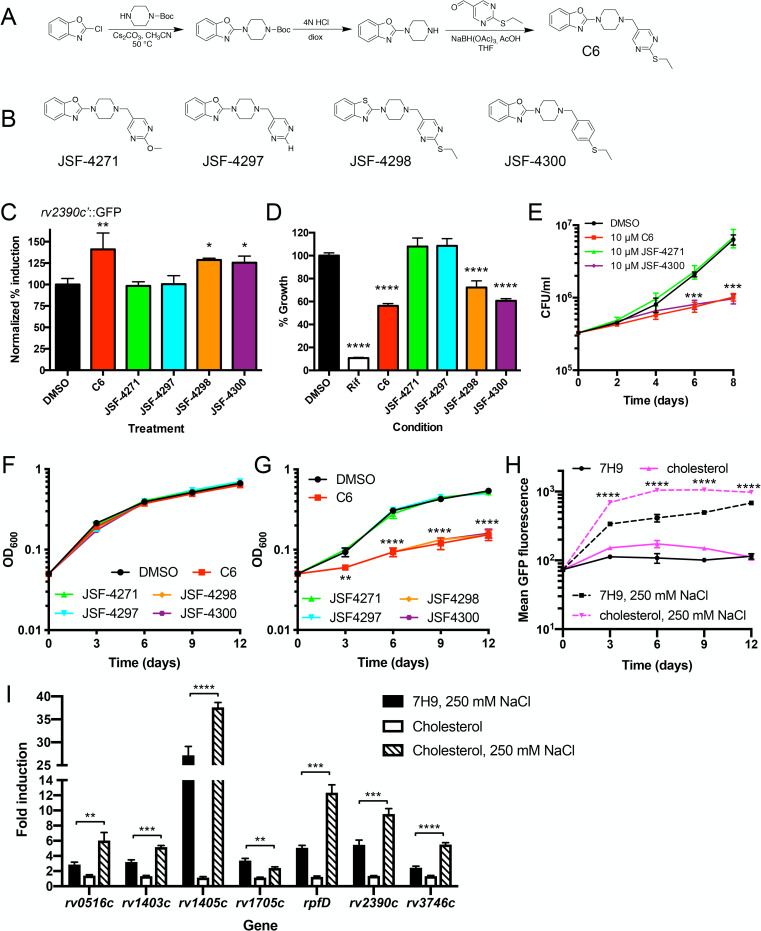
Fig 2. SAR analysis reveals that the chloride response phenotype of C6 tracks with inhibition of Mtb growth in macrophages.
(A) Schematic for synthesis of C6. (B) Structures of C6 analogs synthesized. (C–E) C6 analogs that lose the ability to increase Mtb response to high [Cl−] also lose the Mtb growth inhibition phenotype in J774 cells and primary BMDMs. (C) The rv2390c′::GFP reporter Mtb strain was grown in 7H9 (pH 7) ± 250 mM NaCl and treated with DMSO, 10 μM C6, or 10 μM C6 analogs (JSF-4271, JSF-4297, JSF-4298, or JSF-4300) for 9 days and samples fixed and reporter GFP induction analyzed by flow cytometry. Data are shown as means ± SD from 3 independent experiments. p-values were obtained with a one-way ANOVA with a Dunnett multiple corrections test, and treatment sets compared to the DMSO control. *p < 0.05, **p < 0.01. (D) J774 macrophage-like cells were infected with Mtb constitutively expressing mKO and treated with DMSO, 5 μM rifampicin, 10 μM C6, or 10 μM C6 analogs (JSF-4271, JSF-4297, JSF-4298, or JSF-4300). Bacterial growth was tracked by fluorescence, with readings taken 6 days post-infection. DMSO is the carrier control, and growth in that condition is set at 100%. Data are shown as means ± SD from 4 wells. p-values were obtained with a one-way ANOVA with a Dunnett multiple corrections test, and treatment sets compared to the DMSO control. ****p < 0.0001. (E) BMDMs were infected with WT Mtb and bacterial load determined at indicated times. DMSO as a carrier control, 10 μM C6 or 10 μM C6, or 10 μM C6 analogs (JSF-4271, JSF-4297, JSF-4298, or JSF-4300) was added 2 hours post-infection. Data are shown as means ± SD from 3 wells. p-values were obtained with an unpaired t test, comparing each treatment to the DMSO control for a given time point, and apply to both C6 and JSF-4300. ***p < 0.001. (F) C6 does not affect Mtb growth in standard 7H9 media. Mtb was grown in standard 7H9 media and cultures treated with DMSO or 10 μM of indicated compounds. OD600 was tracked over time. Data are shown as means ± SD from 3 independent experiments. (G) C6 analogs that lose the ability to increase Mtb response to high [Cl−] also lose the Mtb growth inhibition phenotype in cholesterol media. Mtb was grown in cholesterol media and cultures treated with DMSO or 10 μM of indicated compounds. OD600 was tracked over time. Data are shown as means ± SD from 3 independent experiments. p-values were obtained with an unpaired t test, comparing each treatment to the DMSO control for a given time point, and apply to C6, JSF-4298, and JSF-4300. **p < 0.01, ****p < 0.0001. (H) High [Cl−] in the presence of cholesterol media increases expression of the rv2390c′::GFP reporter. The rv2390c′::GFP reporter Mtb strain was grown in 7H9 (pH 7) ± 250 mM NaCl or cholesterol media (pH 7) ± 250 mM NaCl, and samples fixed every 3 days for 12 days. Reporter GFP signal was analyzed by flow cytometry, and data are shown as means ± SD from 3 independent experiments. p-values were obtained with an unpaired t test, comparing the high [Cl−]/cholesterol to the high [Cl−] condition for a given time point. ****p < 0.0001. (I) Mtb response to high [Cl−] is augmented in the presence of cholesterol. qRT-PCR of gene expression of WT Mtb exposed to 7H9 (pH 7) ± 250 mM NaCl or cholesterol media (pH 7) ± 250 mM NaCl, for 4 hours. Data are shown as means ± SD from 3 technical replicates, representative of 3 independent experiments. p-values were obtained with an unpaired t test, comparing the cholesterol, 250 mM NaCl condition to the 7H9, 250 mM NaCl condition for each gene. **p < 0.01, ***p < 0.001, ****p < 0.0001. The numerical data underlying the graphs shown in this figure are provided in S1 Data. BMDM, bone marrow–derived macrophage; mKO, monomeric Kusabira Orange; Mtb, Mycobacterium tuberculosis; qRT-PCR, quantitative real-time PCR; SAR, structure–activity relationship; WT, wild-type.

