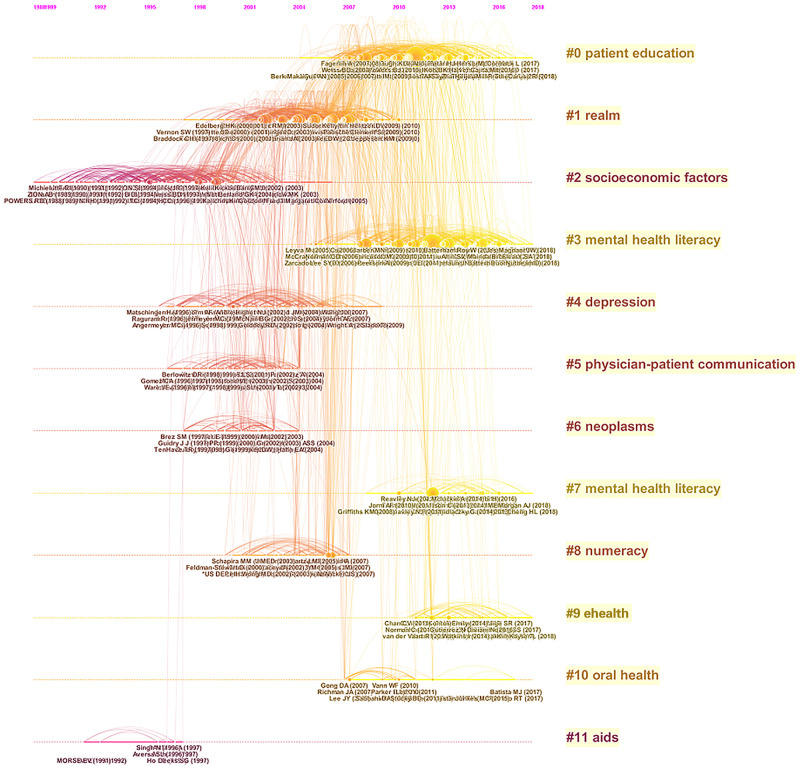
Fig 8. Timeline view of health literacy.
This figure presents 12 clusters, which are arranged and numbered in ascending order from #0 to #11, with the colors corresponding to the average year in which the clusters were active. The larger the node, the more times it was cocited. Each cluster represents an area that has been developed or is developing Hence, the closer the arch body is to the right, the newer the topic.

