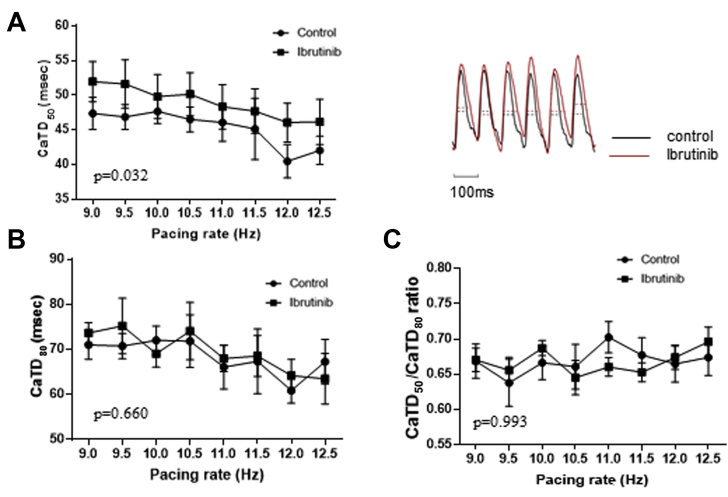
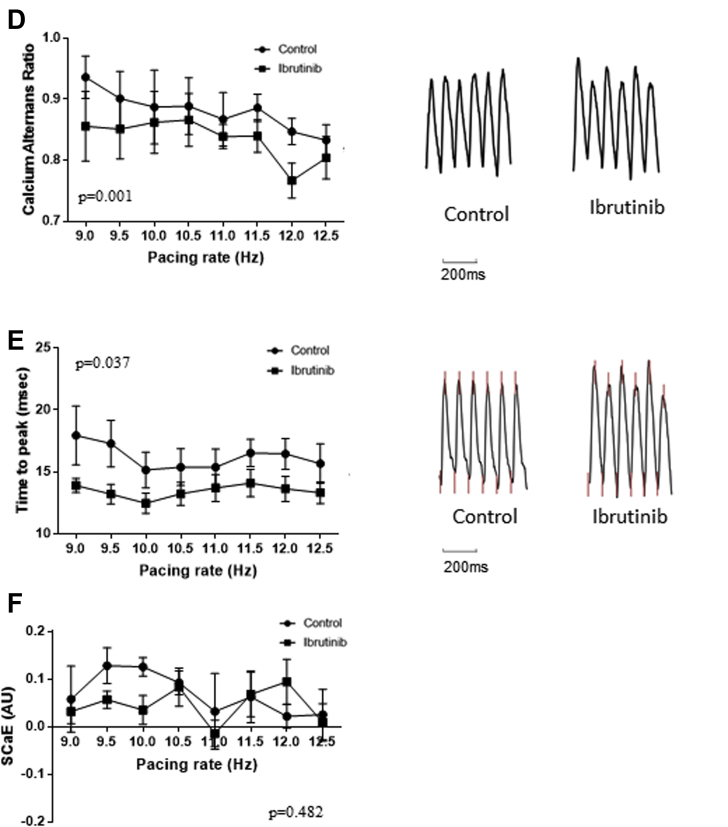
Figure 5.
Cytosolic Calcium Dynamics in Old SHRs
(A) (Left) CaTD50 was prolonged in ibrutinib-treated hearts compared with controls. (Right) Representative calcium tracings from ibrutinib-treated and control hearts of old SHR at 10.0 Hz. (B) No significant difference in CaTD80 between the two groups. (C) No significant difference in CaTD50/CaTD80 ratio between the two groups. (D) (Left) Ca2+ amplitude alternans ratios at various pacing rates were lower in ibrutinib-treated hearts than in controls. (Right) Representative tracings from ibrutinib-treated and control hearts at 10.0 Hz. Ibrutinib-treated hearts had more prominent alternans. (E) (Left) Time-to-peak was shorter in ibrutinib-treated hearts than in control hearts. (Right) Representative tracings from ibrutinib-treated and control hearts at 10.0 Hz. The upstroke part of CaTs is steeper in ibrutinib-treated hearts. (F) SCaE at various pacing rates in ibrutinib-treated and control hearts were not significantly different (n = 7 in each group). CaTD = calcium transient duration; CaTs = calcium transients; SCaE = spontaneous calcium elevation; other abbreviation as in Figure 2.


