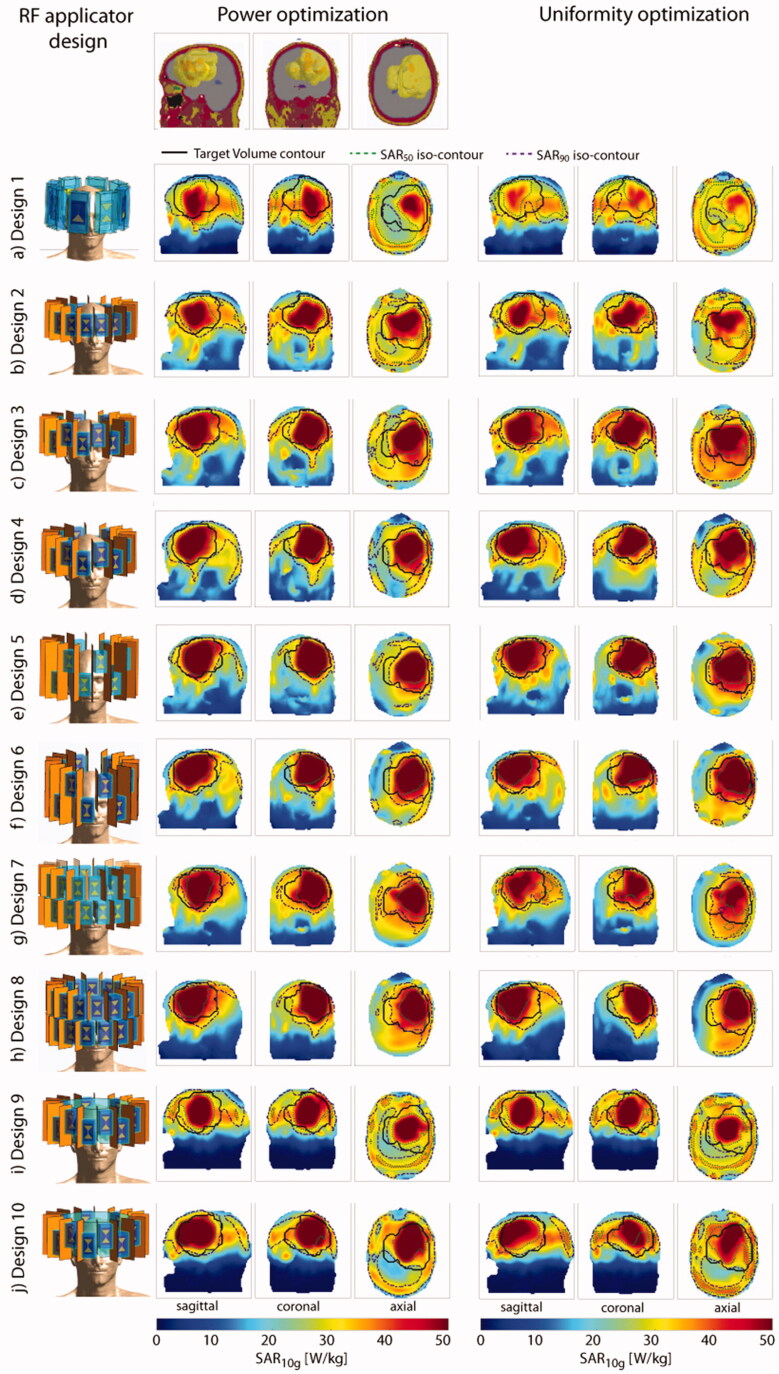
Figure 5.
Top row: sagittal, coronal and axial section through the large tumor model. Left: description and front view of each design simulated together with the large tumor model; maximum intensity projection of the SAR10g distribution after hyperthermia treatment planning for the power optimization (center) and the uniformity optimization (right).

