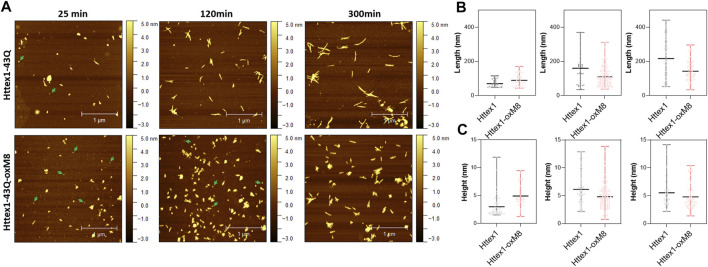
FIGURE 3.
AFM analysis comparison between unmodified and Httex1-43Q-OxM8. (A) Time-dependent AFM images of aggregates formed by Httex1-43Q and Httex1-43Q-oxM8 (nm, nanometer), the oligomers are indicated with green arrows. Quantitative analysis of the length (B) and height (C) of fibrils measured from AFM images. All the plots for the length and height of the Httex1-43Q-oxM8 fibrils differ from the Httex1-43Q with a statistical significance of at least p < 0.05 (scattered plot represents the mean and range).

