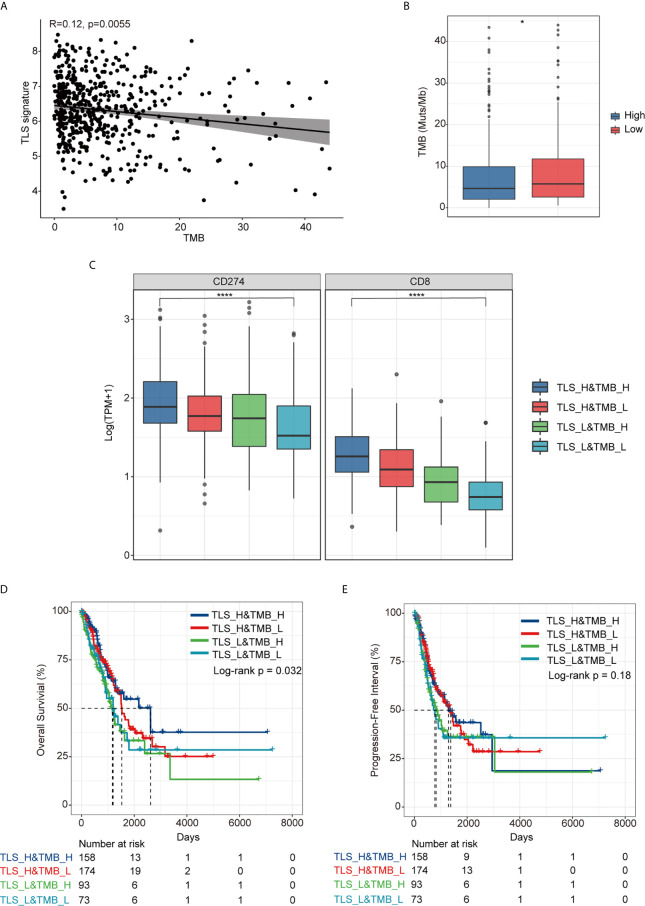
Figure 3.
Relationship between TLS signature and TMB. (A) A correlation between TLS signature and TMB; (B) Differences in TMB between the TLS signature high (n = 337) and low groups (n = 169); (C) Differences in the expression of PD-L1 and CD8 gene among TLS high and TMB high group(TLS_H&TMB_H, n = 158), TLS high and TMB low group (TLS_H&TMB_L, n = 174), TLS low and TMB high group(TLS_L&TMB_H, n = 93), and TLS low and TMB low group (TLS_L&TMB_L, n = 73), Kruskal-Wallis test,*P < 0.05; ****P < 0.0001; (D) Differences in overall survival among the four indicated groups; (E) Differences in progression free survival among the four indicated groups.

