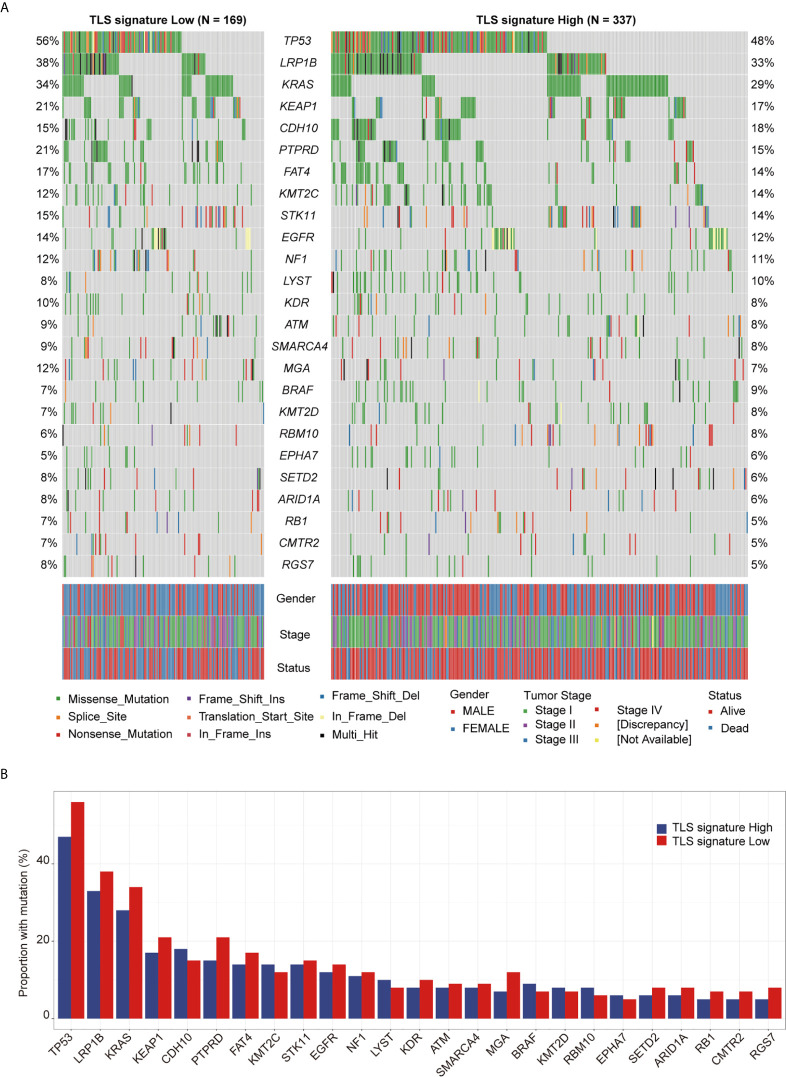
Figure 4.
Relationship between TLS signature and mutation status of the driver genes. (A) Differences in the landscape of driver gene mutations between the TLS signature high (n = 336) and low groups (n = 169), the OncoPlot shows the significant mutated driver genes in LUAD tumors (≥5% in both groups); (B) Differences in mutational frequencies of top driver genes (≥5% in both groups) between the TLS signature high (n = 336) and low groups (n = 169).

