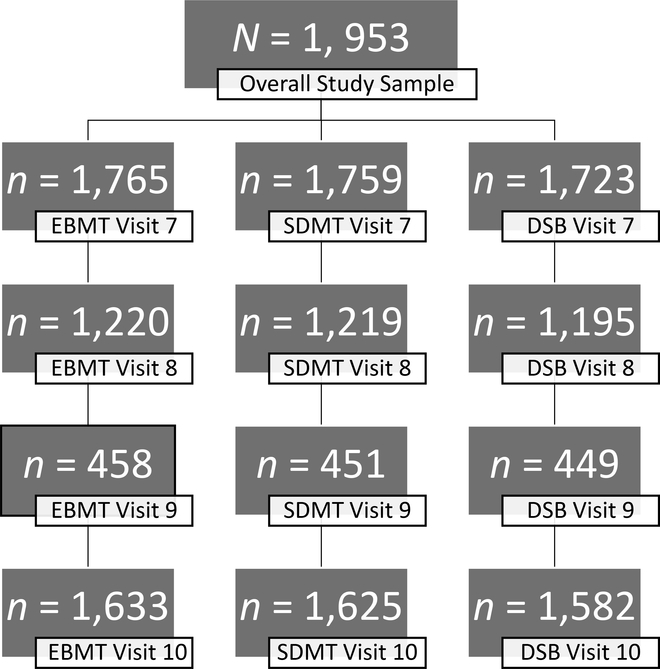
Figure 1: Flow Chart of Study Attrition Across Visit 7 (Baseline) Through Visit 10.
Note. Not all participants completed all three cognitive measures at each time point. Participants were administered the cognitive testing at either visit 8 or visit 9. Full Information Maximum Likelihood (FIML) accounts for missingness in the data by estimating a likelihood of scores for each participant based on existing data available. If participants had at least one data point then they were included in analysis, thus the overall model fit is based on the overall study sample, N = 1,953.

