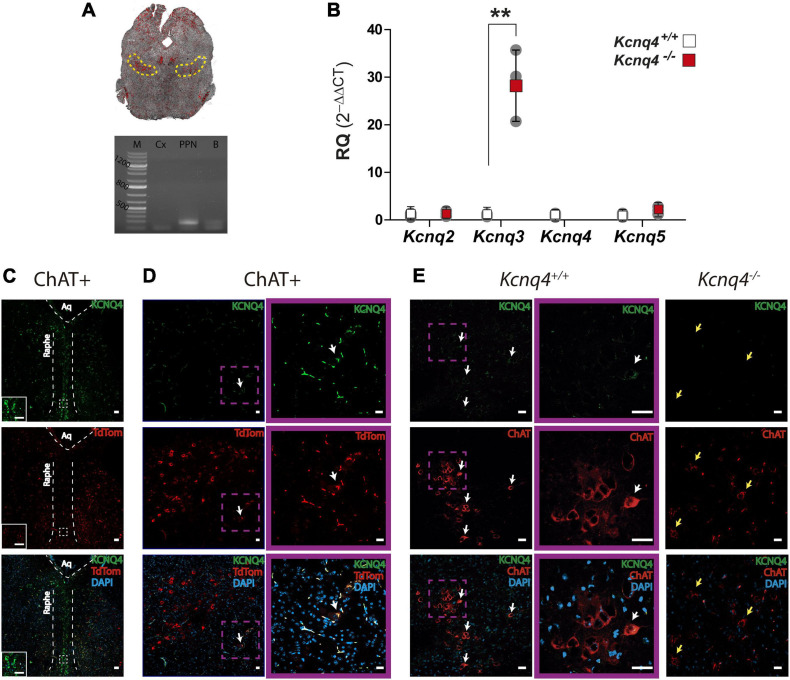
FIGURE 2.
KCNQ subunits expression in the PPN.(A) Top: Confocal image of a coronal midbrain slice (–4.60 mm from bregma), showing the location of the PPN determined by ChAT labeling (yellow dashed line), which corresponds to the area where tissue samples were collected. Bottom: Agarose gel showing PCR band corresponding to ChAT expression. M: molecular weight marker, Cx: brain cortex (negative control), PPN: sample containing the PPN, B: whole brain (positive control). (B) Relative quantification (RQ) of mRNA expression for each subunit from WT (white) and KO (red) mice. The fold change of each subunit was calculated using 2–ΔΔCt. Data represented as mean ± SD (n = 3). Student’s t-test; **p = 0.0028). (C) Brain coronal section of a ChAT-tdTomato mouse midbrain showing KCNQ4 staining in the raphe nucleus. The inset is a higher magnification of the section delimited by the white square with dashed line. Scale bar: 50 μm in both pictures. (D,E) KCNQ4 immunofluorescence on coronal brain sections of ChAT-tdTomato (ChAT+; D), WT (Kcnq4+/+; E), and KCNQ4 KO mice (Kcnq4–/–; E). Both models revealed that only a subpopulation of PPN cholinergic neurons located on the external limits possess KCNQ4 (white arrows). Higher magnification of KCNQ4-positive neurons (purple square). KCNQ4 could not be detected on PPN cholinergic neurons in KO animals (yellow arrows) that confirmed the specificity of the antibody. Upper panel: KCNQ4 (green). Middle panel: ChAT immunolabeling or tdTomato expression under ChAT promoter (red). Bottom panel: Merged image with DAPI. Scale bar: 20 μm.

