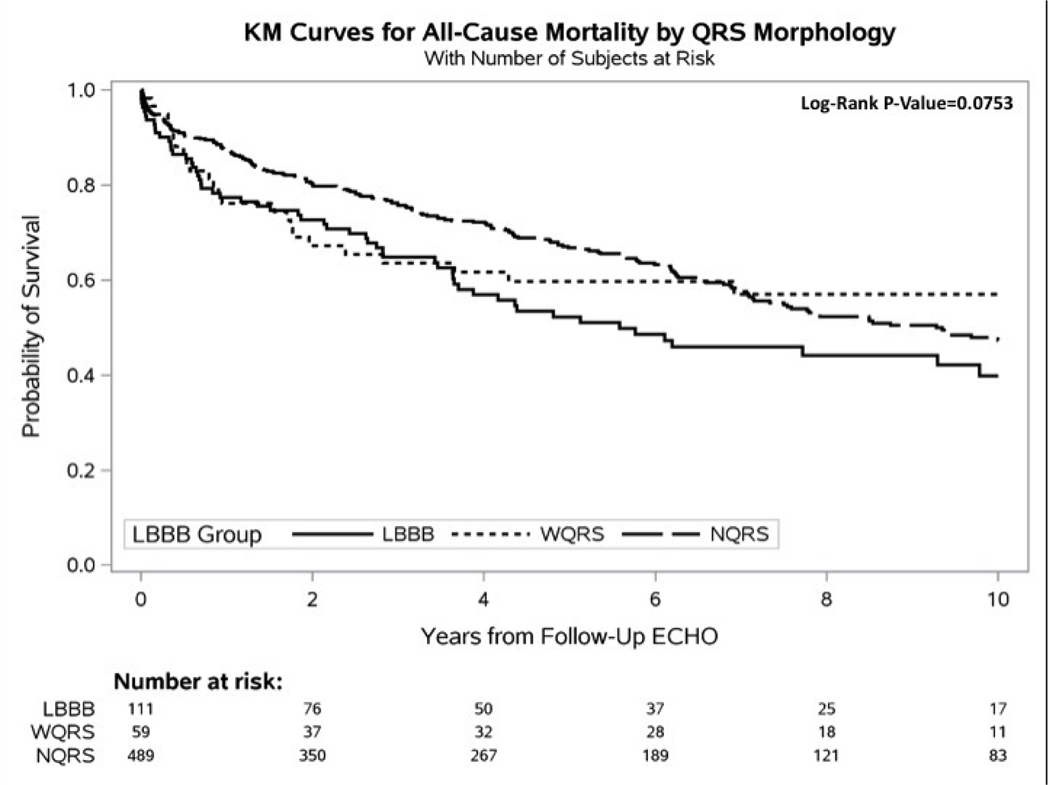
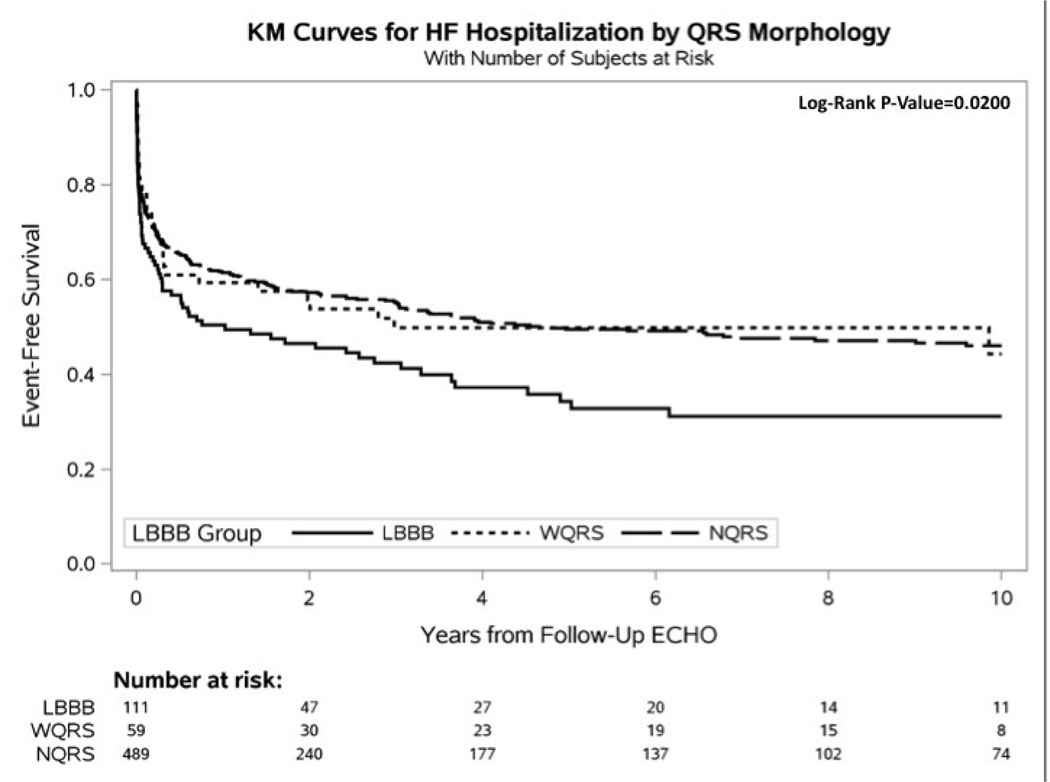
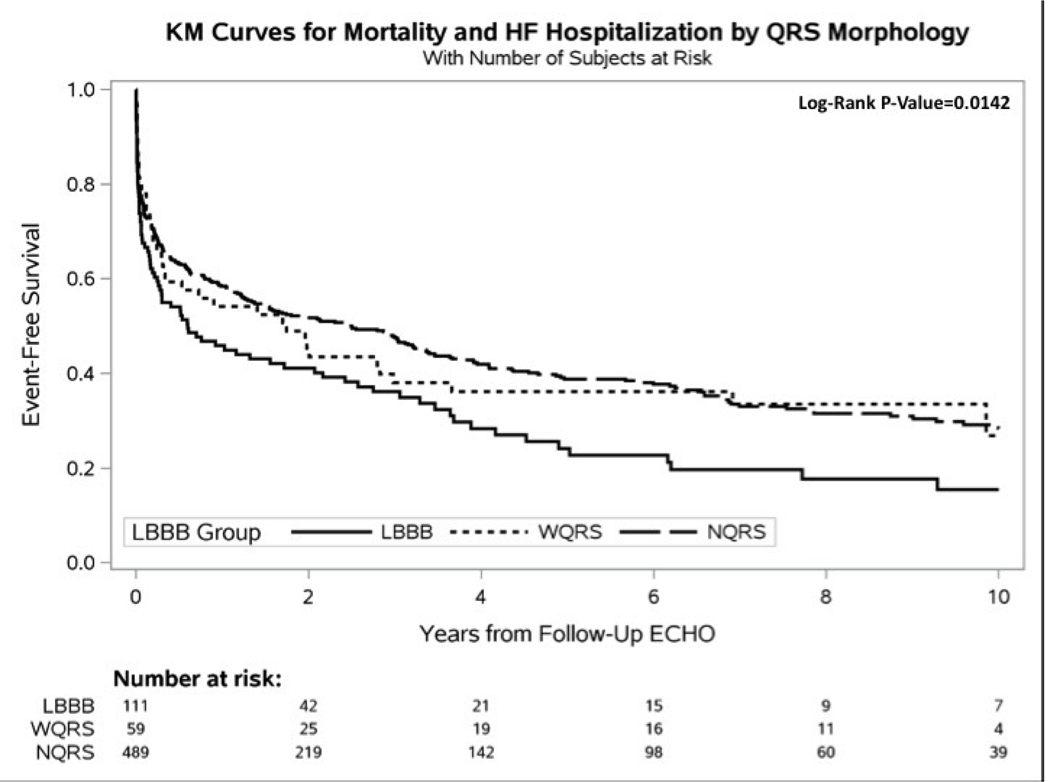
Figure 3 –
Kaplan-Meier Curves. A. Time-to-Mortality, B. Time-to-Heart Failure Hospitalization, and C. Time-to-Heart Failure Hospitalization or Mortality. Mortality data was acquired through the National Death Index (NDI). Heart failure hospitalization data was acquired through the medical record at Duke-affiliated hospitals. Because all Echos were performed prior to 2015, events were censored at December 31, 2014, matching the end date of the NDI query. All curves were censored at 10 years post follow-up Echo.


